Quick answer: The jobs AI touches least are physical, in-person and licensed. In Microsoft Research's scores for 785 occupations, physician assistants (0.05), dental hygienists (0.06), occupational therapists (0.11) and registered nurses (0.12) all sit below the median job (0.14). Interpreters (0.49), writers (0.45) and customer service reps (0.41) score highest. The BLS projects nurse practitioners to grow 41.0% and physician assistants 21.1% from 2025 to 2035, against 3.5% for all jobs.
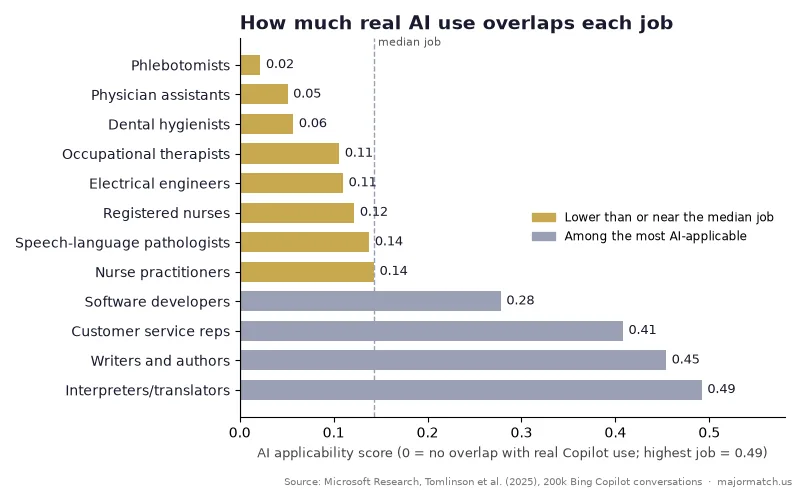
Two jobs show the gap clearly. An interpreter turns speech in one language into another. A phlebotomist finds a vein in a nervous patient's arm and draws blood. In Microsoft Research's study of 200,000 real Bing Copilot conversations, the interpreter's work came up constantly. Interpreters had the highest AI applicability score of any job, 0.49. The phlebotomist's work barely came up: 0.02, near the bottom of 785 occupations.
Most of what you read about "jobs AI won't replace" is a guess about what AI might do someday. This guide uses something firmer: records of what people already use AI for at work. Microsoft, Anthropic and Google have each published that kind of data. We matched Microsoft's job-level scores to the Bureau of Labor Statistics' projections for 2025 to 2035 by occupation code. Then we kept the jobs that score low on AI, grow faster than average and pay well.
One note on scope. This page covers jobs. If your real question is which college majors are safest, our ranked list of AI-proof college majors covers that. Jobs that don't need a degree are in our guide to AI-proof careers without a degree. This page connects jobs to majors at the end.
How do we know which jobs AI is actually touching?
Researchers have tried to answer this in two ways.
The first is to predict. In 2023, OpenAI and University of Pennsylvania researchers had people and GPT-4 rate every task in the government's O*NET job database. The question for each task: could a large language model do it at least twice as fast? Their paper, GPTs are GPTs, estimated that about 80% of U.S. workers have at least 10% of their tasks exposed, and about 19% have at least half exposed. That tells you what is possible. It doesn't tell you what is happening.
The second is to observe. Three AI companies have now published what people actually use their tools for at work:
- Microsoft Research (Tomlinson et al., 2025) analyzed 200,000 anonymized U.S. Bing Copilot conversations from January to September 2024. Each one was matched to O*NET work activities. The result is an AI applicability score for each job: how much of its work overlaps with what people get help with, and how well the AI does it. The scores are public on GitHub. The authors write that "most occupations have at least some AI applicability."
- Anthropic built an observed exposure measure from Claude usage (March 2026). It gives more weight to automated use than to people using AI as a helper. Computer programmers top the list at 75% task coverage. Meanwhile, 30% of workers have zero coverage, including cooks, motorcycle mechanics, lifeguards and bartenders.
- Google's AI & Economy ATLAS (July 2026) mapped 15 million Gemini interactions to more than 800 occupations. In the median occupation with any AI use, AI touched only 21% of tasks. Only 3% of occupations showed AI use on more than three-quarters of their tasks.
The three data sets measure different things, but they agree on the main point. AI use is wide but shallow. It is heaviest in work done at a keyboard and lightest in work done with hands, in a room, with other people. The usage data is also a snapshot: Microsoft's covers 2024, and AI tools have improved since then. The broad pattern shows up in all three, collected on different products from 2024 to 2026. The exact scores will move.
Which jobs is AI least likely to replace?
We started with all 785 jobs Microsoft scored and joined them to the BLS Employment Projections table by occupation code. Then we kept jobs that clear four bars:
- An AI applicability score low enough that at least 35% of scored jobs rank higher
- Projected growth from 2025 to 2035 at or above the 3.5% average for all jobs
- A median wage of at least $60,000
- An associate degree or more to get in
Here are 16 of the jobs that made it, sorted by yearly openings:
| Job | AI applicability score (Microsoft) | Projected growth, 2025–35 | Openings per year | Median pay (2025) | Typical entry education | Majors that lead there |
|---|---|---|---|---|---|---|
| Registered nurses | 0.12 (58% of jobs score higher) | +5.6% | 180,800 | $97,550 | Bachelor's degree | Nursing |
| Medical and health services managers | 0.16 (43% of jobs score higher) | +24.2% | 62,300 | $123,860 | Bachelor's degree | Healthcare administration, health services |
| Construction managers | 0.15 (49% of jobs score higher) | +9.1% | 49,700 | $114,990 | Bachelor's degree | Construction management, civil engineering |
| Nurse practitioners | 0.14 (50% of jobs score higher) | +41.0% | 29,400 | $132,300 | Master's degree | Nursing (BSN, then a master’s or DNP) |
| Logisticians | 0.16 (44% of jobs score higher) | +17.6% | 26,600 | $82,320 | Bachelor's degree | Supply chain management |
| Physical therapist assistants | 0.04 (90% of jobs score higher) | +23.0% | 18,500 | $68,380 | Associate's degree | Associate PTA program |
| Occupational health and safety specialists | 0.15 (48% of jobs score higher) | +18.5% | 17,100 | $90,150 | Bachelor's degree | Environmental science, public health |
| Dental hygienists | 0.06 (85% of jobs score higher) | +8.0% | 15,000 | $98,100 | Associate's degree | Associate dental hygiene program |
| Physical therapists | 0.17 (39% of jobs score higher) | +11.9% | 13,400 | $102,760 | Doctoral or professional degree | Kinesiology or exercise science, then a DPT |
| Speech-language pathologists | 0.14 (52% of jobs score higher) | +16.6% | 12,500 | $97,870 | Master's degree | Communication disorders, then a master’s |
| Mental health and substance abuse social workers | 0.15 (49% of jobs score higher) | +10.3% | 12,500 | $60,280 | Master's degree | Social work (MSW for clinical roles) |
| Physician assistants | 0.05 (88% of jobs score higher) | +21.1% | 11,500 | $135,880 | Master's degree | Biology or health science, then a PA master’s |
| Electrical engineers | 0.11 (63% of jobs score higher) | +9.9% | 11,400 | $120,630 | Bachelor's degree | Electrical engineering |
| Occupational therapists | 0.11 (65% of jobs score higher) | +14.8% | 10,000 | $100,330 | Master's degree | Kinesiology, psychology or health science, then a master’s |
| Veterinarians | 0.16 (46% of jobs score higher) | +9.4% | 3,100 | $130,100 | Doctoral or professional degree | Biology or animal science, then a DVM |
| Nurse anesthetists | 0.08 (77% of jobs score higher) | +9.7% | 2,400 | $236,590 | Master's degree | Nursing, ICU experience, then a doctorate |
Three things stand out.
Health care dominates. Ten of the 16 jobs are clinical. Nurse practitioners are projected to grow 41.0%, the fastest of all 784 occupations in the BLS table, from a base of about 336,300 jobs in 2025.
Managers of physical operations hold up. Medical and health services managers (+24.2%), construction managers (+9.1%) and logisticians (+17.6%) all score near the middle on AI. Their jobs are about people, sites and schedules that don't sit inside a computer.
You don't always need a four-year degree. Physical therapist assistants (score 0.04, growth +23.0%) and dental hygienists (0.06, +8.0%) need an associate degree.
Which of these careers fits your teen?
Take the free adaptive assessment (about 10 to 20 minutes) to see your top 3 major matches, scored with our own proprietary scoring method. The full Pathfinder report is $29 if you want the deeper plan.
Take the assessment →Why are these jobs hard for AI to replace?
Read the actual task lists in O*NET and the reason is plain. Here are three tasks from the physician assistant's O*NET profile:
- "Examine patients to obtain information about their physical condition."
- "Make tentative diagnoses and decisions about management and treatment of patients."
- "Prescribe therapy or medication with physician approval."
An AI can help with the middle task. It can suggest diagnoses and draft notes. It can't do the first task, because the patient is in the room and the AI isn't. And the third task carries a license and legal liability that a software product doesn't hold.
Across the jobs in the table, we see four shields:
- A body or a place. The work happens on a patient, a construction site or a power system. Google's ATLAS found that nearly a third of heavily physical occupations showed no AI use at all.
- A license and a signature. Someone has to be accountable when it goes wrong: a nurse, a PA, an engineer who stamps a drawing. Anthropic notes that some tasks AI could do in theory, like authorizing prescription refills, simply don't show up in real use. Legal limits and required human checks may be part of the reason.
- Trust built face to face. Therapy, speech treatment and social work run on a relationship built over many sessions.
- Decisions with messy inputs. A construction manager weighs weather, crews, inspectors and a budget at once. The GPTs are GPTs authors found that science and critical-thinking skills go with lower exposure. Programming and writing skills go with higher exposure.
Which careers will AI replace, or change the most?
The other end of the list looks like this. All of these jobs have high AI applicability, and their growth ranges from slow to sharply negative:
| Job | AI applicability score | Projected growth, 2025–35 | Median pay |
|---|---|---|---|
| Interpreters and translators | 0.49 | +2.0% | $60,170 |
| Writers and authors | 0.45 | −0.3% | $76,910 |
| Customer service representatives | 0.41 | −5.3% | $44,770 |
| Data entry keyers | 0.32 | −25.5% | $41,340 |
| Computer programmers | 0.31 | −7.3% | $100,390 |
Anthropic's observed-exposure data points the same way. Programmers, customer service reps and data entry keyers (67% of tasks covered) are among the most exposed. Anthropic also found that across all jobs, every 10-point rise in coverage goes with BLS growth projections about 0.6 points lower. For a full career-by-career risk check, see Which Jobs Will AI Replace?
Does a low AI score mean a job is safe?
Not on its own. Microsoft's authors say clearly that a high score doesn't mean job loss. Their example is the ATM. It automated a core task of bank tellers, yet the number of teller jobs went up, because banks opened more branches and tellers moved toward relationship work. It works the other way too.
Look at these jobs. Most people would guess they are AI-resistant:
| Job | AI applicability score | Share of jobs that score higher | Projected growth, 2025–35 |
|---|---|---|---|
| Child, family and school social workers | 0.33 | 5% | +4.4% |
| Pharmacists | 0.28 | 15% | +5.2% |
| Lawyers | 0.18 | 36% | +4.7% |
| Elementary school teachers | 0.19 | 34% | −0.4% |
| Secondary school teachers | 0.18 | 38% | −0.2% |
Child, family and school social workers score 0.33, higher than 95% of all jobs. A lot of that job is case notes, court reports and paperwork. Teachers score fairly low, yet the BLS projects almost no growth in teaching jobs. A low score protects a job from AI. It doesn't create demand.
So use two tests together: low AI applicability and real projected demand. The table above uses both.
What is happening to young workers in AI-exposed jobs?
This part matters most for students. Stanford's Digital Economy Lab (Brynjolfsson, Chandar and Chen, revised August 2026) used ADP payroll data through June 2026. They found no sign of economy-wide job losses. But employment of 22- to 25-year-olds in the most AI-exposed jobs is 19% below where it would be if it had kept pace with less-exposed peers. Experienced workers show no such gap. The gap comes mainly from less hiring, not layoffs. It shows up where AI replaces tasks, not where it helps workers do them. The authors call these early, descriptive signals, not proof of cause.
Anthropic found something similar in government survey data. Unemployment hasn't risen for exposed workers. But the rate at which 22- to 25-year-olds start new jobs in highly exposed occupations fell about 14% after ChatGPT's release, a result the authors call "just barely statistically significant." Workers have noticed: in a Pew Research Center survey, 52% of U.S. workers said they were worried about AI's future impact at work, and 32% expected fewer job opportunities for themselves.
The point for a 17-year-old: AI so far hasn't hit the jobs themselves. It has hit the first rung of exposed careers. Jobs in the table above have a first rung that AI can't easily take, because a new grad nurse or PA does hands-on work from day one.
Which college majors lead to jobs AI can't replace?
Each job in the table traces back to a short list of majors. These are the strongest routes, with each major's own calculator so you can weigh the cost against the payoff:
- Nursing leads to registered nurse, nurse practitioner and nurse anesthetist, three of the 16 jobs. New York Fed data shows nursing grads have 2.1% recent-grad unemployment and 12.8% underemployment, among the lowest of any major. Nursing calculator.
- Communication disorders leads to speech-language pathology. Communication disorders calculator.
- Kinesiology and exercise science lead to physical and occupational therapy, both of which need a graduate degree. Exercise science calculator.
- Construction management and civil engineering lead to construction manager. Construction services grads have 2.2% recent-grad unemployment. Construction management calculator.
- Electrical engineering has a score of 0.11 and growth of 9.9%. Electrical engineering calculator.
- Health services administration and supply chain lead to the manager and logistics jobs. Supply chain calculator.
For all 100 majors ranked on AI risk, use the AI-proof college majors guide. That guide ranks majors; this one ranks jobs. If your teen leans toward business or tech, we wrote separate deep dives: which business majors are AI-proof and whether computer science is still worth it.
Three free tools help you check a path before you commit to it. The Major Earnings Continuum maps 100 majors to their careers and mid-career pay. The Major Payoff Report 2026 ranks 100 majors by payoff. The degree loan vs. upside calculator compares what a degree costs against what it tends to pay back.
How can you tell if a career is AI-resistant?
Here is the four-question check we use when a family asks about a job that isn't on any list:
- Where is the work done? If the answer is "on a laptop," assume AI will change it. If it's "on a person, a site or a machine," it is harder to replace.
- Who signs off? Jobs that need a license, a stamp or legal accountability change more slowly.
- Is the core work routine? Google's ATLAS found that more than a quarter of AI conversations about routine cognitive work aimed to automate the task. For non-routine thinking work, the share was under 10%.
- Is demand growing for other reasons? An aging population drives health care. Infrastructure spending drives construction and power. Check the BLS projection, not just the AI score.
The World Economic Forum’s Future of Jobs Report 2025 lands in a similar place. Employers expect care jobs, including nursing professionals and social workers, to grow a lot by 2030, driven by aging populations. And the International Labour Organization (2025) concluded that because most jobs still need human input, "transformation of jobs is the most likely impact" of generative AI, not outright replacement.
Frequently asked questions
What jobs will AI never replace?
No study promises "never," but the jobs with the least AI overlap involve hands-on work with people or physical systems, plus a license. In Microsoft Research's scores for 785 jobs, physician assistants (0.05), dental hygienists (0.06), surgical technologists and phlebotomists score near the bottom. Registered nurses (0.12) and occupational therapists (0.11) are well below the median job (0.14).
What jobs are safest from AI that pay well?
Jobs with low AI applicability, above-average growth and six-figure median pay include nurse practitioners ($132,300, +41.0% growth to 2035), physician assistants ($135,880, +21.1%), medical and health services managers ($123,860, +24.2%), construction managers ($114,990) and electrical engineers ($120,630), per BLS data.
Which jobs are least affected by AI right now?
In Anthropic's March 2026 usage data, 30% of U.S. workers are in jobs with zero observed AI coverage, such as cooks, motorcycle mechanics, lifeguards, bartenders and dishwashers. Google's ATLAS found that nearly a third of heavily physical occupations showed no AI use.
Will AI replace nurses?
The usage data says no. Registered nurses score 0.12 on Microsoft's AI applicability scale, lower than about 58% of jobs. The BLS projects about 180,800 RN openings a year through 2035. AI is more likely to take over charting and paperwork than patient care.
What careers will AI replace?
The most exposed careers are keyboard jobs built on routine information work. Data entry keyers are projected to shrink 25.5% and computer programmers 7.3% by 2035. Customer service reps (−5.3%) have one of the highest AI applicability scores. See our job-by-job AI risk guide.
Are trades safe from AI?
Mostly, yes. Electricians score 0.15, plumbers 0.07 and HVAC mechanics 0.12 on Microsoft's scale, and all are projected to grow faster than average. Our AI-proof careers without a degree guide covers them.
Does a low AI score mean a career is a good choice?
No. Teachers score fairly low on AI applicability, but the BLS projects flat teacher employment through 2035. Check both the AI score and real projected demand, then check fit. The MajorMatch assessment takes 10 to 20 minutes and shows your teen's top 3 major matches free.
Sources
Every figure on this page comes from the documents below. MajorMatch joined the Microsoft Research occupation scores to the BLS 2025–35 projections table by SOC code; that join is our own analysis.
- Tomlinson, Jaffe, Wang, Counts and Suri (Microsoft Research), “Working with AI: Measuring the Applicability of Generative AI to Occupations,” arXiv 2507.07935 (2025)
- Microsoft Research, working-with-ai data repository (AI applicability scores for 785 occupations)
- U.S. Bureau of Labor Statistics, Employment Projections 2025–35, Table 1.2: Occupational projections and worker characteristics
- BLS Occupational Outlook Handbook, Nurse Anesthetists, Nurse Midwives, and Nurse Practitioners
- O*NET OnLine, Physician Assistants (29-1071.00) task list; O*NET 30.0 database
- Massenkoff and McCrory (Anthropic), “Labor market impacts of AI: A new measure and early evidence” (March 5, 2026)
- Iscenko, Strand et al. (Google and Google DeepMind), “Google’s AI & Economy ATLAS v1.0: Mapping Gemini Usage in the Economy” (July 23, 2026)
- Eloundou, Manning, Mishkin and Rock (OpenAI / University of Pennsylvania), “GPTs are GPTs,” arXiv 2303.10130 (2023)
- Brynjolfsson, Chandar and Chen, “Canaries in the Coal Mine? Six Facts about the Recent Employment Effects of Artificial Intelligence,” Stanford Digital Economy Lab (revised August 12, 2026)
- Pew Research Center, “U.S. Workers Are More Worried Than Hopeful About Future AI Use in the Workplace” (February 25, 2025)
- World Economic Forum, Future of Jobs Report 2025 (press release, January 8, 2025)
- Gmyrek et al., “Generative AI and Jobs: A Refined Global Index of Occupational Exposure,” ILO Working Paper 140 (May 2025)
- Federal Reserve Bank of New York, The Labor Market for Recent College Graduates, Outcomes by Major (February 2026 release)