Quick answer
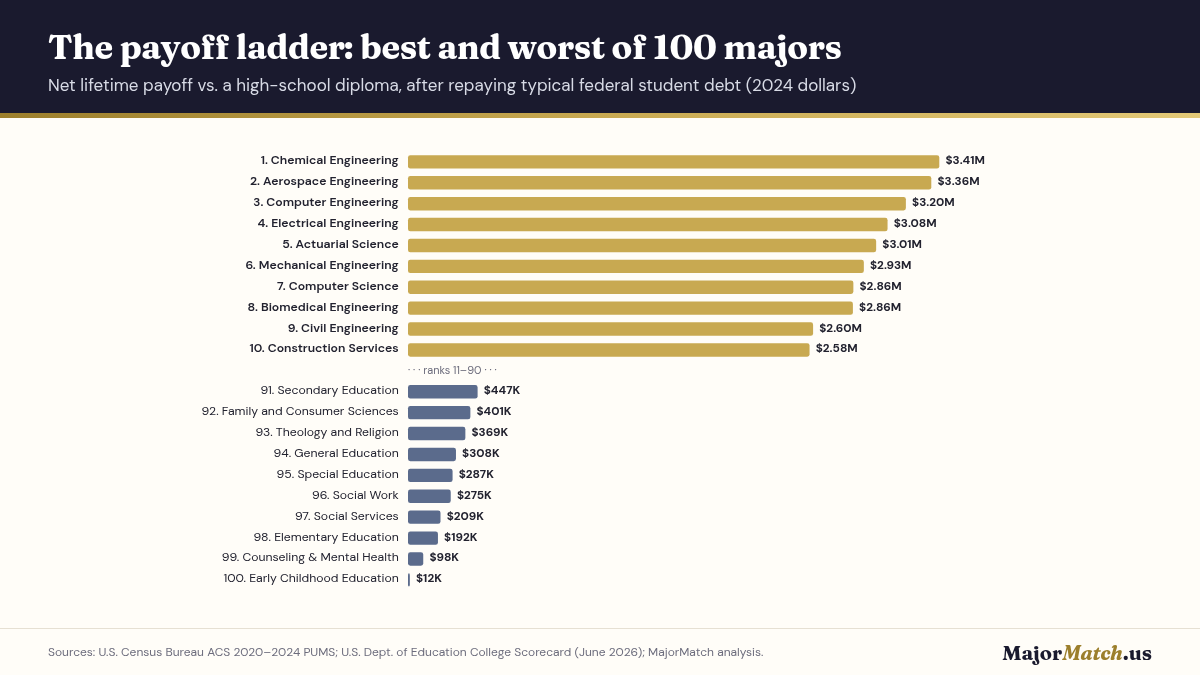
Chemical engineering has the best payoff of 100 majors in 2026: about $3.41M more than a high-school graduate earns over a career, after repaying typical student debt. Engineering and computing hold 8 of the top 10 spots. Typical federal debt barely changes by major ($18,721–$26,963), but lifetime earnings change by more than $3.4 million. That's why the major matters far more than the loan.
Every spring, families make one of the biggest financial decisions of their lives with almost no numbers. We built this report to fix that. We ranked MajorMatch's 100 majors on three things families care about: how much more graduates earn over a career, what they typically borrow, and how long it takes for the degree to pay for itself. Every figure comes from the Census Bureau, the Department of Education or the Bureau of Labor Statistics, and the method is published in full.
What are the key findings of the 2026 report?
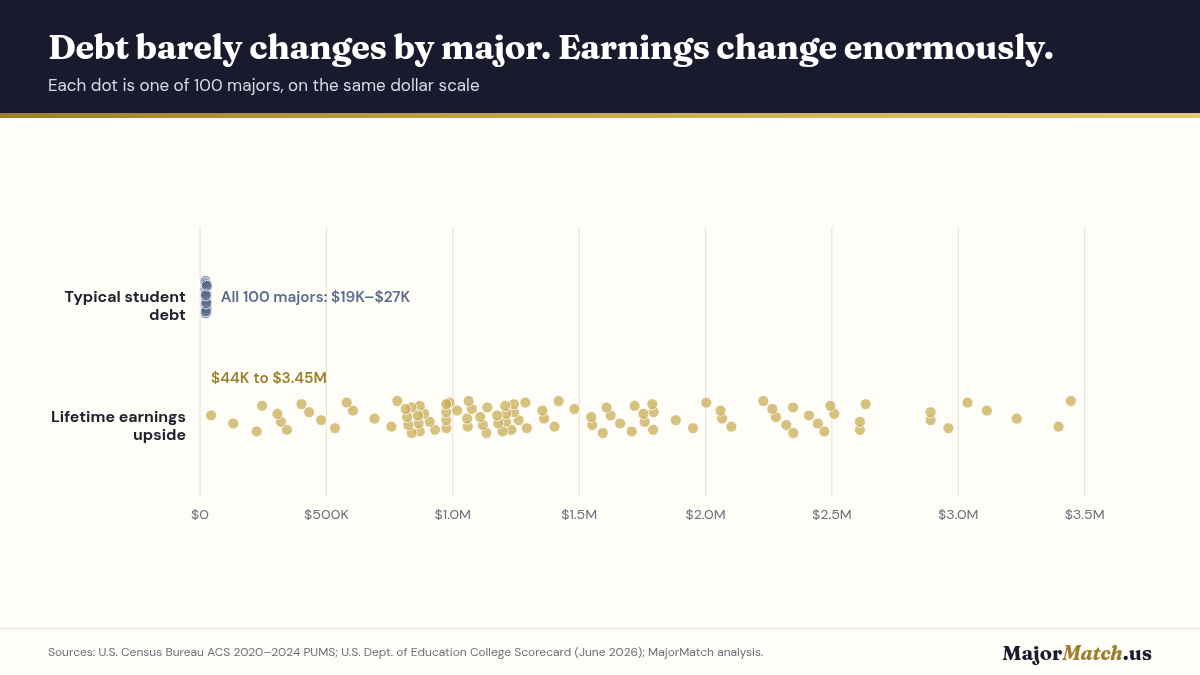
- Your major moves lifetime earnings about 400 times more than it moves your debt. Across all 100 majors, typical federal student debt sits in a narrow band: $18,721 to $26,963. Lifetime earnings upside over a high-school diploma ranges from $44K to $3.45M. The earnings gap between the top and bottom majors is more than 400 times the debt gap.
- Chemical engineering is the top payoff major of 2026. A chemical engineering graduate comes out $3.41M ahead of a high-school graduate over a working life, after repaying typical debt. Engineering and computing hold 8 of the top 10 spots. Actuarial science (#5) and construction services (#10) are the only exceptions.
- The bachelor's degree still pays: about $1.4 million over a career. A typical bachelor's graduate working full time earns $3.60M from ages 22 to 64, compared with $2.18M for a full-time high-school graduate from ages 18 to 64. That is a premium of $1.41M in 2024 dollars, before taxes.
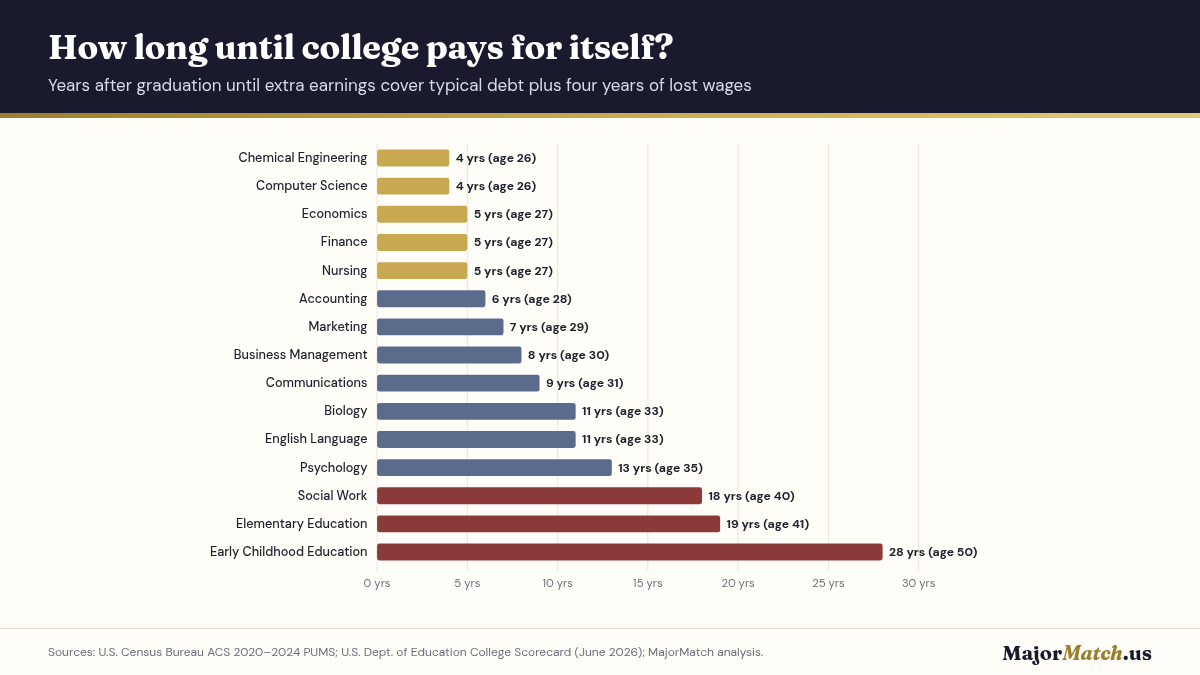
- Break-even ranges from 4 years after graduation to 28. Counting typical debt plus four years of lost wages, graduates in 23 majors are financially ahead of a high-school graduate within 5 years of finishing college. In 11 majors it takes 15 years or more. Early childhood education doesn't break even until about age 50.
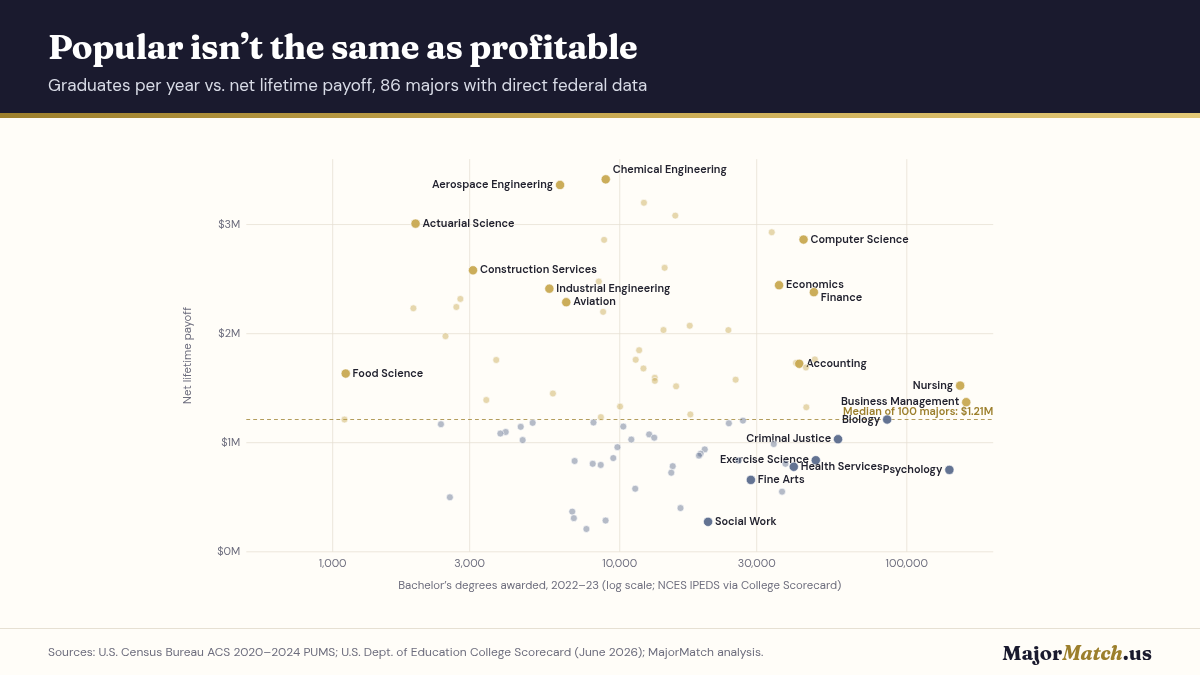
- Popular isn't the same as profitable. General psychology is the third most-awarded bachelor's field in the country (117,436 credentials in 2022–23) but ranks #85 of 100 on a bachelor's degree alone. Criminal justice (#64) and exercise science (#76) also draw far more students than their payoff would suggest.
- In business, the exact major is worth about $1 million. Economics (#14) and finance (#16) beat business management (#44) by about $1.1M and $1.0M over a career, with almost identical typical debt ($19,574, $21,359 and $22,773).
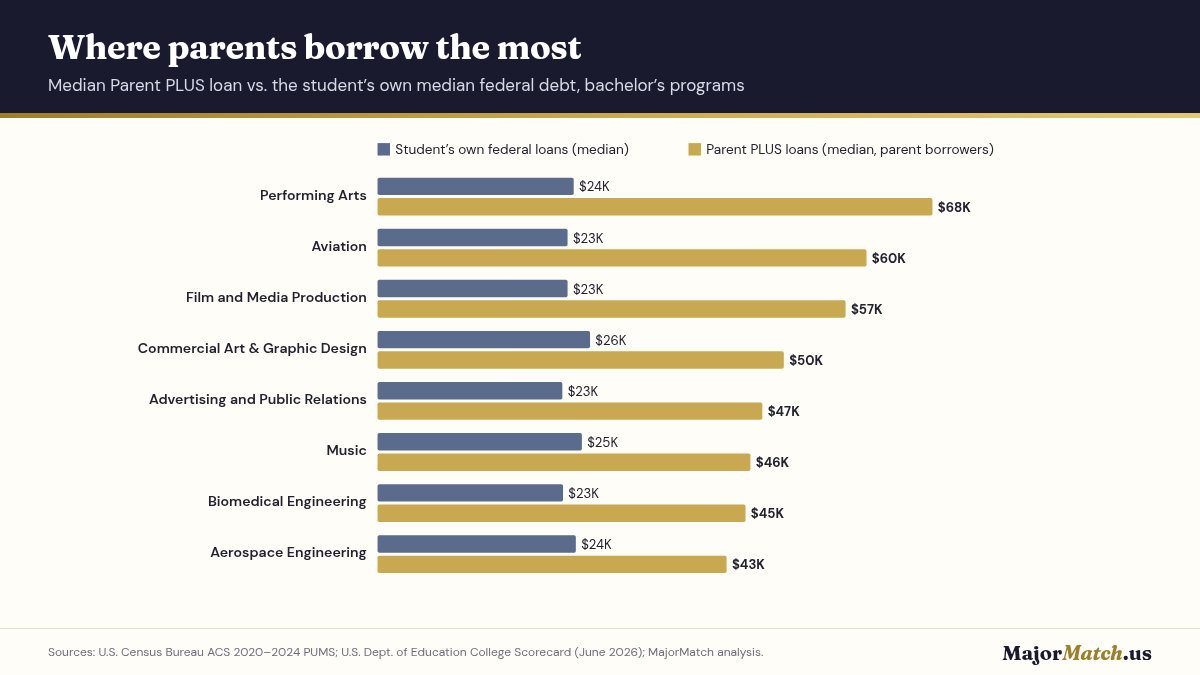
- Parents often borrow more than their kids. In 87 of 91 majors with enough data, the median Parent PLUS loan (among families who take one) is bigger than the student's own median federal debt. In performing arts it's $67,892 for parents versus $24,000 for students. New loans now carry a 9.07% rate, and since July 1, 2026 they're capped at $20,000 a year and $65,000 per student.
Which college majors have the best payoff in 2026?
The ten majors with the largest net lifetime payoff are Chemical Engineering, Aerospace Engineering, Computer Engineering, Electrical Engineering, Actuarial Science, Mechanical Engineering, Computer Science, Biomedical Engineering, Civil Engineering and Construction Services. In every one of them, graduates are ahead of a high-school graduate within five years of finishing college, even after counting the loan and four years of lost wages.
How do all 100 majors rank?
Net lifetime payoff is lifetime earnings upside over a high-school diploma minus total repayment of typical federal debt. Data grade A means a direct federal match, B means grouped codes, and C means a proxy or shared code. Majors within about $100,000 of each other are effectively tied.
| Rank | Major | Net lifetime payoff | Lifetime upside | Typical debt | Monthly payment | Break-even (yrs) | Median pay, ages 25–34 | Data grade |
|---|---|---|---|---|---|---|---|---|
| 1 | Chemical Engineering | $3.41M | $3.45M | $22,732 | $258 | 4 | $99,000 | A |
| 2 | Aerospace Engineering | $3.36M | $3.40M | $24,262 | $276 | 4 | $98,000 | A |
| 3 | Computer Engineering | $3.20M | $3.23M | $22,875 | $260 | 4 | $103,000 | A |
| 4 | Electrical Engineering | $3.08M | $3.11M | $22,664 | $258 | 4 | $97,000 | A |
| 5 | Actuarial Science | $3.01M | $3.04M | $20,138 | $229 | 4 | $100,000 | A |
| 6 | Mechanical Engineering | $2.93M | $2.96M | $22,777 | $259 | 4 | $93,000 | A |
| 7 | Computer Science | $2.86M | $2.89M | $20,495 | $233 | 4 | $99,000 | A |
| 8 | Biomedical Engineering | $2.86M | $2.89M | $22,700 | $258 | 5 | $93,000 | A |
| 9 | Civil Engineering | $2.60M | $2.63M | $22,250 | $253 | 4 | $89,000 | A |
| 10 | Construction Services | $2.58M | $2.61M | $22,000 | $250 | 5 | $86,000 | B |
| 11 | Construction Management | $2.58M | $2.61M | $23,037 | $262 | 5 | $86,000 | C |
| 12 | Miscellaneous Engineering | $2.48M | $2.51M | $23,000 | $261 | 5 | $92,000 | B |
| 13 | Business Analytics | $2.46M | $2.49M | $21,500 | $244 | 4 | $89,000 | C |
| 14 | Economics | $2.44M | $2.47M | $19,574 | $222 | 5 | $92,000 | A |
| 15 | Industrial Engineering | $2.41M | $2.44M | $23,250 | $264 | 4 | $93,000 | A |
| 16 | Finance | $2.38M | $2.41M | $21,359 | $243 | 5 | $89,000 | A |
| 17 | Data Science | $2.32M | $2.35M | $19,500 | $222 | 4 | $89,000 | C |
| 18 | Pharmacy | $2.32M | $2.35M | $21,412 | $243 | 10 | $61,000 | B |
| 19 | Aviation | $2.29M | $2.32M | $23,250 | $264 | 7 | $81,000 | B |
| 20 | General Engineering | $2.24M | $2.28M | $25,350 | $288 | 5 | $86,000 | A |
| 21 | Environmental Engineering | $2.23M | $2.26M | $23,000 | $261 | 5 | $81,000 | A |
| 22 | Physics | $2.20M | $2.23M | $21,148 | $240 | 7 | $78,000 | A |
| 23 | Information Systems & Management | $2.07M | $2.10M | $22,000 | $250 | 6 | $81,000 | B |
| 24 | Engineering Technologies | $2.03M | $2.07M | $24,000 | $273 | 6 | $81,000 | B |
| 25 | Mathematics | $2.03M | $2.06M | $19,500 | $222 | 6 | $78,000 | A |
| 26 | Public Policy and Law | $1.98M | $2.00M | $19,500 | $222 | 6 | $78,000 | B |
| 27 | Supply Chain Management | $1.92M | $1.95M | $22,773 | $259 | 5 | $84,000 | C |
| 28 | Cybersecurity | $1.85M | $1.88M | $25,000 | $284 | 5 | $79,000 | B |
| 29 | Information Technology | $1.76M | $1.79M | $22,166 | $252 | 5 | $75,000 | B |
| 30 | Neuroscience | $1.76M | $1.79M | $21,134 | $240 | 9 | $69,000 | B |
| 31 | Architecture | $1.76M | $1.79M | $25,250 | $287 | 8 | $72,000 | A |
| 32 | Political Science | $1.73M | $1.76M | $20,500 | $233 | 8 | $73,000 | A |
| 33 | Accounting | $1.72M | $1.75M | $22,250 | $253 | 6 | $77,000 | A |
| 34 | Marketing | $1.69M | $1.72M | $21,825 | $248 | 7 | $73,000 | A |
| 35 | Biochemistry | $1.68M | $1.71M | $19,729 | $224 | 9 | $68,000 | A |
| 36 | Food Science | $1.63M | $1.66M | $20,632 | $234 | 7 | $73,000 | A |
| 37 | Chemistry | $1.60M | $1.62M | $21,250 | $242 | 10 | $66,000 | A |
| 38 | General Business | $1.58M | $1.61M | $22,500 | $256 | 7 | $72,000 | A |
| 39 | International Affairs | $1.57M | $1.59M | $19,632 | $223 | 7 | $73,000 | A |
| 40 | Nursing | $1.52M | $1.55M | $21,291 | $242 | 5 | $76,000 | A |
| 41 | Advertising and Public Relations | $1.52M | $1.55M | $22,605 | $257 | 7 | $73,000 | A |
| 42 | Earth Sciences | $1.45M | $1.48M | $22,250 | $253 | 10 | $64,000 | B |
| 43 | Geography | $1.39M | $1.42M | $20,123 | $229 | 9 | $68,000 | A |
| 44 | Business Management | $1.37M | $1.40M | $22,773 | $259 | 8 | $70,000 | A |
| 45 | Journalism | $1.33M | $1.36M | $22,000 | $250 | 9 | $67,000 | A |
| 46 | Communications | $1.33M | $1.35M | $21,500 | $244 | 9 | $67,000 | A |
| 47 | Environmental Science | $1.26M | $1.29M | $20,500 | $233 | 9 | $63,000 | A |
| 48 | Radiologic Science | $1.26M | $1.29M | $24,959 | $284 | 7 | $68,000 | C |
| 49 | Ethnic Studies | $1.23M | $1.26M | $18,998 | $216 | 11 | $61,000 | A |
| 50 | Miscellaneous Physical Sciences | $1.21M | $1.24M | $21,685 | $246 | 9 | $66,000 | B |
| 51 | Biology | $1.21M | $1.24M | $21,546 | $245 | 11 | $61,000 | A |
| 52 | Miscellaneous Biological Science | $1.20M | $1.23M | $21,256 | $242 | 11 | $61,000 | B |
| 53 | Agriculture | $1.19M | $1.21M | $18,721 | $213 | 9 | $63,000 | B |
| 54 | Medical Technicians | $1.18M | $1.21M | $21,000 | $239 | 8 | $68,000 | B |
| 55 | History | $1.18M | $1.21M | $21,237 | $241 | 11 | $61,000 | A |
| 56 | Public Administration | $1.17M | $1.20M | $20,000 | $227 | 10 | $61,000 | A |
| 57 | Human Resources | $1.15M | $1.18M | $23,250 | $264 | 9 | $66,000 | A |
| 58 | Environmental Studies | $1.15M | $1.18M | $21,750 | $247 | 10 | $61,000 | B |
| 59 | Art History | $1.10M | $1.14M | $23,113 | $263 | 11 | $58,000 | C |
| 60 | Miscellaneous Technologies | $1.10M | $1.13M | $25,300 | $288 | 10 | $60,000 | B |
| 61 | Treatment Therapy | $1.08M | $1.12M | $25,449 | $289 | 13 | $56,000 | B |
| 62 | Film and Media Production | $1.08M | $1.11M | $23,250 | $264 | 11 | $61,000 | A |
| 63 | Philosophy | $1.05M | $1.08M | $21,706 | $247 | 9 | $67,000 | A |
| 64 | Criminal Justice | $1.03M | $1.06M | $22,500 | $256 | 11 | $61,000 | A |
| 65 | Mass Media | $1.03M | $1.06M | $22,250 | $253 | 10 | $61,000 | A |
| 66 | Legal Studies | $1.02M | $1.06M | $23,875 | $271 | 10 | $61,000 | A |
| 67 | English Language | $988K | $1.02M | $21,497 | $244 | 11 | $60,000 | A |
| 68 | Leisure and Hospitality | $959K | $988K | $20,691 | $235 | 11 | $60,000 | B |
| 69 | Fashion Design & Merchandising | $940K | $974K | $25,537 | $290 | 10 | $61,000 | C |
| 70 | Commercial Art & Graphic Design | $939K | $974K | $26,000 | $295 | 10 | $61,000 | A |
| 71 | Interior Design | $939K | $974K | $26,000 | $295 | 10 | $61,000 | C |
| 72 | Game Design | $939K | $974K | $26,000 | $295 | 10 | $61,000 | C |
| 73 | Public Health | $900K | $930K | $21,500 | $244 | 10 | $61,000 | A |
| 74 | Foreign Language | $881K | $909K | $20,205 | $230 | 12 | $60,000 | B |
| 75 | Animal and Plant Sciences | $859K | $887K | $20,265 | $230 | 14 | $55,000 | B |
| 76 | Exercise Science | $839K | $870K | $22,501 | $256 | 12 | $60,000 | B |
| 77 | Sports Management | $839K | $870K | $22,501 | $256 | 12 | $60,000 | C |
| 78 | Sociology | $837K | $865K | $20,625 | $234 | 10 | $61,000 | A |
| 79 | General Social Sciences | $832K | $861K | $21,551 | $245 | 12 | $58,000 | B |
| 80 | Liberal Arts | $807K | $837K | $21,852 | $248 | 13 | $56,000 | A |
| 81 | Nutrition Sciences | $807K | $837K | $22,500 | $256 | 11 | $62,000 | B |
| 82 | Anthropology | $796K | $824K | $20,475 | $233 | 11 | $60,000 | A |
| 83 | Music | $785K | $819K | $25,000 | $284 | 13 | $56,000 | A |
| 84 | Health Services | $779K | $814K | $25,000 | $284 | 12 | $58,000 | B |
| 85 | Psychology | $751K | $780K | $21,500 | $244 | 13 | $56,000 | A |
| 86 | Performing Arts | $725K | $757K | $24,000 | $273 | 15 | $53,000 | B |
| 87 | Fine Arts | $659K | $691K | $23,125 | $263 | 13 | $56,000 | B |
| 88 | Communication Disorders | $578K | $605K | $19,872 | $226 | 16 | $54,000 | A |
| 89 | Interdisciplinary Studies | $551K | $580K | $21,278 | $242 | 13 | $56,000 | B |
| 90 | Miscellaneous Education | $499K | $534K | $25,250 | $287 | 14 | $53,000 | B |
| 91 | Secondary Education | $447K | $479K | $23,572 | $268 | 14 | $54,000 | C |
| 92 | Family and Consumer Sciences | $401K | $432K | $22,497 | $256 | 16 | $52,000 | B |
| 93 | Theology and Religion | $369K | $402K | $24,218 | $275 | 17 | $52,000 | A |
| 94 | General Education | $308K | $344K | $26,000 | $295 | 16 | $52,000 | A |
| 95 | Special Education | $287K | $320K | $24,616 | $280 | 16 | $50,000 | A |
| 96 | Social Work | $275K | $306K | $23,000 | $261 | 18 | $50,000 | A |
| 97 | Social Services | $209K | $246K | $26,963 | $306 | 17 | $51,000 | B |
| 98 | Elementary Education | $192K | $224K | $23,500 | $267 | 19 | $50,000 | C |
| 99 | Counseling & Mental Health | $98K | $132K | $25,000 | $284 | 19 | $49,000 | C |
| 100 | Early Childhood Education | $12K | $44K | $23,500 | $267 | 28 | $49,000 | C |
How much student debt do graduates have by major?
The median federal loan debt of bachelor's completers who borrowed ranges from $18,721 to $26,963 across the 100 majors. The overall median is $22,250. It's this flat because federal law caps what a dependent undergraduate can borrow, about $27,000 over four years. 92% of bachelor's programs with reported debt have a median at or below that amount. On a standard 10-year plan at today's 6.52% rate, typical debt costs $213 to $306 a month.
How long does it take for a college degree to pay off?
For the median major, about 10 to 10 years after graduation. 23 majors break even within five years, and 11 take 15 years or more. Early childhood education breaks even at about age 50.
Which popular majors are overrated, and which are underrated?
General psychology is the third most-awarded bachelor's field in the country, yet psychology ranks #85 of 100 on a bachelor's degree alone. Business management, the most-awarded field, ranks #44, about $1 million behind finance and economics. On the other side, actuarial science (#5), construction services (#10) and industrial engineering (#15) pay off handsomely, and few students choose them.
Do the hardest majors pay off?
Mostly, yes. 8 of the 10 highest-payoff majors are on MajorMatch's list of the 15 hardest majors. But hard science majors that usually lead to graduate school (chemistry, biochemistry, physics, cell and molecular biology) rank between #22 and #52 on a bachelor's alone. Federal data also shows how often students change course: NCES found that 52% of beginning students who declared mathematics, and 40% in the natural sciences, switched majors within three years.
More on the hardest majors:
- Hardest majors that actually pay off
- Hardest majors with the lowest debt-to-earnings
- Easiest college majors that pay well
What should parents know before borrowing?
Among families who take a Parent PLUS loan, the median parent loan is larger than the student's own median federal debt in 87 of 91 majors. New Parent PLUS loans carry a fixed 9.07% rate, and since July 1, 2026 most new borrowers are capped at $20,000 a year and $65,000 per student. Choose the major first, judge it by its break-even age rather than its starting salary, and price in graduate school if the career needs it.
Then test a major's numbers with your own loan in the Loan vs. Upside calculator, or explore career paths on the Major Earnings Continuum.
How did we calculate the payoff?
We matched each of MajorMatch's 100 majors to the Census Bureau's field-of-degree codes and to the Education Department's 4-digit program codes. We then measured three things on federal data: what graduates earn over a career, what they typically borrow, and how long the degree takes to pay for itself. Lifetime earnings use 2.4 million records of full-time, year-round workers from the Census Bureau's American Community Survey 2020–2024 Public Use Microdata Sample, in 2024 dollars. Typical debt is the borrower-weighted median of program-level federal loan medians from the College Scorecard (June 2026 release), de-duplicated so branch campuses aren't counted twice. Repayment uses the 2026–27 undergraduate rate of 6.52%. Rankings barely move when we discount future earnings, inflate debt, drop for-profit programs or add Parent PLUS loans (rank correlation 0.998 or higher).
Why our numbers differ from MajorMatch's tools
This report uses Census Bureau American Community Survey earnings of full-time workers whose highest degree is a bachelor's, by major, in 2024 dollars. MajorMatch's interactive tools (the Major Earnings Continuum and the Loan vs. Upside calculator) use BLS Occupational Employment and Wage Statistics pay for the jobs each major typically leads to, shown as optimistic estimates. The two measure different things, so the figures differ. For Marketing, the tools show about $110,000 early in a career; this report's ACS median for ages 25–34 is $73,463.
What can’t this data tell you?
These are medians for groups of graduates, not predictions for one student. Earnings gaps partly reflect who chooses each major. We count bachelor's-only workers, so fields that feed graduate school look weaker than their full career paths. Federal data has no separate codes for game design, interior design, fashion, sports management or business analytics, so those five use proxies (grade C). Scorecard counts federal loans only. The PDF lists every limitation and data gap.
Where can I download the report and data?
- Full report (PDF, 18 pages)
- Dataset: 100 majors (CSV)
- Charts for media use: payoff ladder · debt vs. earnings · break-even · popular vs. payoff · Parent PLUS
Journalists: please credit MajorMatch, The Major Payoff Report 2026. For interviews or custom cuts of the data, email hello@majormatch.us.
Frequently asked questions
What is the Major Payoff Report 2026?
It's MajorMatch's annual ranking of 100 college majors by financial payoff. For each major we measure lifetime earnings over a high-school diploma (Census Bureau ACS 2020–2024), typical federal student debt (Education Department College Scorecard, June 2026), the cost of repaying that debt at today's 6.52% rate, and how many years after graduation the degree breaks even.
Which college major has the best payoff in 2026?
Chemical engineering. Graduates come out about $3.41M ahead of high-school graduates over a working life after repaying typical debt, and break even about 4 years after graduation. Aerospace engineering ($3.36M) and computer engineering ($3.20M) are second and third.
Which college majors have the lowest payoff?
Early childhood education ranks last ($12K net lifetime payoff on a bachelor's alone), followed by counseling & mental health, elementary education, social services and social work. These numbers count cash earnings only, not pensions, benefits or Public Service Loan Forgiveness.
How much student debt do college graduates have by major?
Less variation than most people think. The median federal loan debt of bachelor's completers who borrowed ranges from $18,721 (agriculture) to $26,963 (social services). On a standard 10-year plan at 6.52%, that's $213 to $306 a month.
How long does it take for a college degree to pay off?
For the median major, about 10–10 years after graduation, counting typical debt and four years of lost wages. 23 majors break even within 5 years. 11 take 15 years or more.
Is psychology a good major financially?
On a bachelor's degree alone, psychology ranks #85 of 100, with a $751K net lifetime payoff and a 13-year break-even. Many of the best-paid psychology careers need graduate school: BLS reports clinical and counseling psychologists earn a median $100,580 (May 2025), and that career typically requires a doctorate.
How much do parents borrow for college?
Among families who take Parent PLUS loans, the median parent loan is larger than the student's own median federal debt in 87 of 91 majors. It's highest in performing arts ($67,892). New Parent PLUS loans carry a 9.07% fixed rate, and since July 1, 2026 most new borrowers are limited to $20,000 a year and $65,000 per student.
How did MajorMatch calculate lifetime earnings?
We summed median earnings of full-time, year-round workers with a bachelor's degree in each major across nine age bands from 22 to 64, using 2.4 million Census Bureau ACS records (2020–2024, in 2024 dollars), then subtracted the same total for high-school graduates aged 18 to 64. The full method, crosswalk and limitations are in the PDF.
Why do these numbers differ from MajorMatch's calculator and Continuum?
This report uses Census Bureau American Community Survey earnings of full-time workers whose highest degree is a bachelor's, by major, in 2024 dollars. MajorMatch's interactive tools (the Major Earnings Continuum and the Loan vs. Upside calculator) use BLS Occupational Employment and Wage Statistics pay for the jobs each major typically leads to, shown as optimistic estimates. The two measure different things, so the figures differ. For Marketing, the tools show about $110,000 early in a career; this report's ACS median for ages 25–34 is $73,463.
Can I download the data?
Yes. The 100-major dataset is available as a CSV on this page, and the full report is a free PDF. Please credit MajorMatch, The Major Payoff Report 2026.
Sources
- U.S. Census Bureau, American Community Survey 2020–2024 5-Year PUMS (released January 2026)
- U.S. Department of Education, College Scorecard field-of-study data (updated June 10, 2026)
- U.S. Department of Education, NCES: IPEDS Completions 2022–23; Data Point NCES 2018-434
- U.S. Bureau of Labor Statistics, Occupational Employment and Wage Statistics, May 2025
- Federal Student Aid, Direct Loan interest rates for 2026–27 (GENERAL-26-33) and Parent PLUS loan limits FAQ (May 2026)