Key takeaway
Students are moving out of computer science and into engineering and health. On the numbers, engineering is the stronger trade. The eight non-computer engineering majors we matched are less exposed to AI (46.6 vs. 54.1 out of 100), and their recent grads are about half as likely to be unemployed (3.6% vs. 6.9%), for about the same early-career pay. Health is a safe landing only for some majors, with nursing at the top. And computer science still pays more early on than every major except computer engineering, so the problem for CS grads is getting hired, not the paycheck.
Almost every fall enrollment story this year has the same plot: students are walking away from computer science. Fewer of them have asked the next question. Are the fields they're moving into actually a better bet for a new graduate, or just different?
We checked. We joined the New York Fed's job outcomes for recent graduates in 73 majors to the AI exposure scores from our 2026 study of 151 majors. Then we compared the fields students are leaving with the ones they're heading toward. Here's what the numbers show, and what they can't tell you.
What did we find?
- Four-year computer science enrollment fell 12.4% this fall, the steepest drop of any field in the National Student Clearinghouse's early count. Health majors grew in every type of program (2.0% to 6.2%), and undergraduate engineering rose more than 6%.
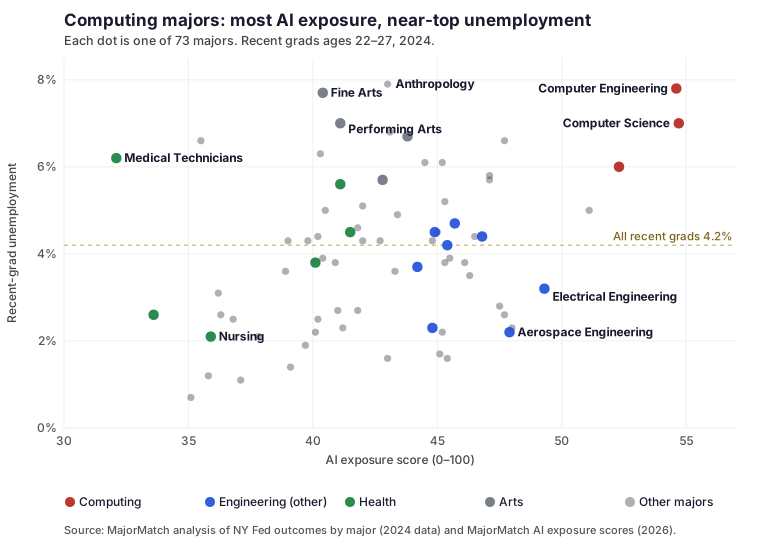
- Computer science and computer engineering rank #1 and #2 of 73 majors on AI exposure (54.7 and 54.6 out of 100). Their recent grads also have the 4th- and 2nd-highest unemployment rates: 7.0% and 7.8%.
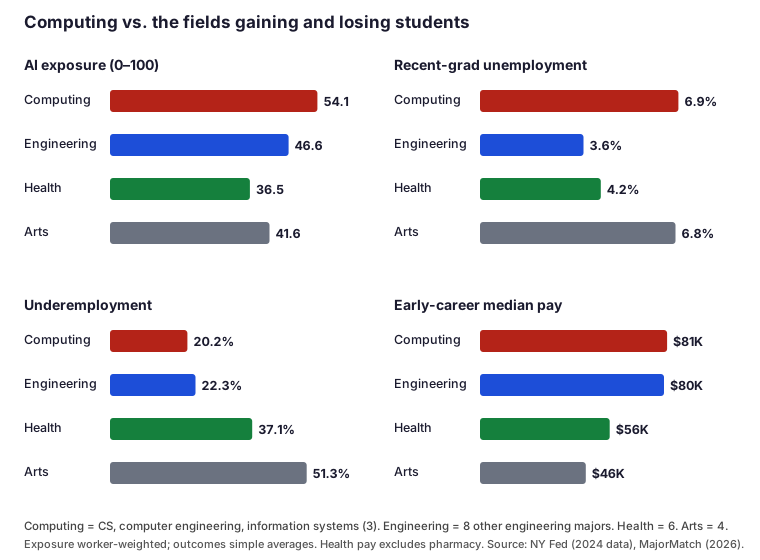
- The eight other engineering majors average 3.6% unemployment for recent grads, about half the 6.9% for computing majors, with nearly the same early-career pay ($80,000 vs. $81,333).
- Nursing has the lowest underemployment of all 73 majors (12.8%). But “health” isn't one thing: 47.0% of recent medical technician grads and 45.1% of health services grads work in jobs that don't need a degree.
- More AI exposure goes with higher pay, not worse job matches. Across 73 majors, exposure rises with early-career pay (rank correlation 0.63) and has only a weak link to underemployment (-0.19).
How fast is computer science enrollment falling?
Fast. The National Student Clearinghouse Research Center's preliminary fall 2026 report, released October 29, 2026, shows computer and information science enrollment down 12.4% at four-year colleges, 12.3% at two-year colleges and 10.4% in graduate programs compared with fall 2025. Total undergraduate enrollment, by contrast, rose 0.6%.
Students are moving elsewhere. Health majors grew across every award and institution type in the report, by 2.0% to 6.2%. Higher Ed Dive's coverage of the same release adds that undergraduate engineering and health professions enrollment each rose more than 6%, while visual and performing arts fell more than 4%.
Keep one caveat in mind: these are early numbers. They cover 46.0% of the institutions that report to the Clearinghouse, and the final fall report is due in January 2027.
Why are students leaving computer science?
The Clearinghouse doesn't survey students about their reasons, so nobody can say for sure. But the job market gives a likely one. In the New York Fed's data for 2024, 7.0% of recent computer science grads (ages 22 to 27) were unemployed, and so were 7.8% of recent computer engineering grads. The rate for all recent grads was 4.2%. Of the 73 majors, only anthropology (7.9%) was higher than computer engineering.
Computing majors also top our AI exposure scores. Computer science scores 54.7 out of 100 and computer engineering 54.6, against a median of 43.0 for the 73 majors. The score measures how much of the work graduates actually do could be sped up by generative AI. It is not a forecast of job losses.
Here's the part the headlines skip. CS grads who do land a job tend to land a good one. Only 19.1% of recent CS grads work in jobs that don't need a degree, compared with 39.4% of all recent grads. Their early-career median pay of $87,000 is second only to computer engineering ($90,000). The trouble is getting hired, not the paycheck.
Is engineering a better bet than computer science?
On the 2024 numbers, yes. Across the eight non-computer engineering majors we matched (aerospace, chemical, civil, electrical, general, industrial, mechanical and miscellaneous engineering):
- AI exposure averages 46.6, against 54.1 for the three computing majors.
- Recent-grad unemployment averages 3.6%, about half the 6.9% for computing.
- Early-career pay averages $80,000, against $81,333. By mid-career, it's $116,625 vs. $117,000.
That's less exposure and roughly half the unemployment for almost the same pay. Even electrical engineering, the most AI-exposed of the eight at 49.3, had 3.2% unemployment. Aerospace and civil engineering grads had the lowest rates in the group, at 2.2% and 2.3%.
One exception matters. If a student leaves computer science for computer engineering, the picture doesn't improve. Computer engineering has the highest early-career pay of any major ($90,000), but also 7.8% unemployment, the second-highest of the 73.
| Group (majors) | AI exposure | Unemployment | Underemployment | Early-career pay | Mid-career pay |
|---|---|---|---|---|---|
| Computing (3) | 54.1 | 6.9% | 20.2% | $81,333 | $117,000 |
| Engineering, non-computer (8) | 46.6 | 3.6% | 22.3% | $80,000 | $116,625 |
| Health (6) | 36.5 | 4.2% | 37.1% | $56,400* | $74,800* |
| Arts (4) | 41.6 | 6.8% | 51.3% | $46,000 | $79,500 |
| All recent grads | – | 4.2% | 39.4% | $58,000 | $87,000 |
Unemployment and underemployment: recent grads ages 22–27, 2024. Pay: median for full-time workers with a bachelor's degree only (early career 22–27, mid-career 35–45). AI exposure is weighted by the number of graduates; the other columns are simple averages of the majors in each group. *Health pay excludes pharmacy, because NY Fed's bachelor's-only pay leaves out PharmD holders.
Want the major-by-major view? See engineering majors ranked by pay and jobs and what you can do with a computer science degree.
Is health a safe place to land?
Some of it is. Nursing has the best job-match numbers in the entire dataset: the lowest underemployment of all 73 majors (12.8%), 2.1% unemployment, an early-career median of $70,000 and AI exposure of 35.9, well below the median.
But "health" isn't one thing. Recent medical technician grads had 6.2% unemployment, and 47.0% worked in jobs that don't need a degree. For health services grads, underemployment was 45.1%. Across the six health majors we matched, AI exposure is low (36.5), but underemployment averages 37.1%.
Part of that gap is about graduate school. Many health careers, like physical therapy, physician assistant and pharmacy, need a graduate degree, and the NY Fed's pay figures cover bachelor's-only workers. That's why pharmacy shows an early-career median of just $40,000: pharmacists with a PharmD aren't counted. If you're choosing a health major, pick the career first, then the degree path. Our guide to the best majors for healthcare careers walks through it.
Why are students leaving the arts too?
Visual and performing arts enrollment fell more than 4% this fall, and AI isn't the obvious reason. The four arts majors we matched score 41.6 on AI exposure, below the median of 43.0.
The problem is underemployment. The arts group averages 51.3%. Performing arts (63.9%) and fine arts (58.9%) are the second- and third-highest of all 73 majors, behind only criminal justice (65.8%). Many arts grads find work, just not work that needs their degree.
Does more AI exposure mean worse job prospects?
Not on its own. Across the 73 majors, AI exposure rises with early-career pay (Spearman rank correlation 0.63) and has only a weak, slightly negative link to underemployment (-0.19). Its link to unemployment is modest (0.27).
In plain terms, the most AI-exposed majors are still among the best-paid starts. Exposure tells you how much of a job's tasks AI could speed up. It doesn't tell you whether those jobs will disappear, and it can't be the only reason to avoid a major. A rule like "avoid AI-exposed majors" would steer students away from many of the best-paying fields in the data.
What should students considering computer science do?
- Separate the subject from the headline. If you love building software, computer science still leads to some of the best-paid first jobs. Expect a harder job search than the major's reputation suggests, and plan for internships early.
- Look at neighboring engineering majors. If what you like is math, physics and building things, electrical, mechanical, civil or industrial engineering offer similar pay with much lower recent-grad unemployment.
- Be specific about "health." Nursing and health services lead to very different outcomes. Check the exact major, not the category.
- Check the numbers for your exact major. Every major's outcomes are in the table below and in the CSV.
If you're not sure which of these paths fits how you think and what you enjoy, a structured assessment can help narrow it down before you commit.
Outcomes and AI exposure for all 73 majors
| Exposure rank | Major | Group | AI exposure | Unemp. | Underemp. | Early pay | Mid-career pay |
|---|---|---|---|---|---|---|---|
| 1 | Computer Science | Computing | 54.7 | 7.0% | 19.1% | $87,000 | $120,000 |
| 2 | Computer Engineering | Computing | 54.6 | 7.8% | 15.8% | $90,000 | $131,000 |
| 3 | Information Systems & Management | Computing | 52.3 | 6.0% | 25.6% | $67,000 | $100,000 |
| 4 | Business Analytics | Other | 51.1 | 5.0% | 28.7% | $72,000 | $109,000 |
| 5 | Electrical Engineering | Engineering (other) | 49.3 | 3.2% | 21.1% | $82,000 | $123,000 |
| 6 | Journalism | Other | 48.0 | 2.3% | 43.3% | $49,000 | $87,000 |
| 7 | Aerospace Engineering | Engineering (other) | 47.9 | 2.2% | 14.7% | $85,000 | $130,000 |
| 8 | Physics | Other | 47.7 | 6.6% | 29.1% | $67,000 | $105,000 |
| 9 | Accounting | Other | 47.7 | 2.6% | 21.2% | $68,000 | $97,000 |
| 10 | Finance | Other | 47.5 | 2.8% | 27.8% | $70,000 | $112,000 |
| 11 | Advertising and Public Relations | Other | 47.1 | 5.7% | 38.1% | $60,000 | $92,000 |
| 12 | Mathematics | Other | 47.1 | 5.8% | 26.2% | $70,000 | $100,000 |
| 13 | Mechanical Engineering | Engineering (other) | 46.8 | 4.4% | 20.1% | $80,000 | $120,000 |
| 14 | Marketing | Other | 46.5 | 4.4% | 49.3% | $60,000 | $100,000 |
| 15 | Economics | Other | 46.3 | 3.5% | 33.1% | $72,000 | $115,000 |
| 16 | Earth Sciences | Other | 46.1 | 3.8% | 31.4% | $50,000 | $75,000 |
| 17 | Chemical Engineering | Engineering (other) | 45.7 | 4.7% | 17.9% | $85,000 | $135,000 |
| 18 | Communications | Other | 45.5 | 3.9% | 53.0% | $52,000 | $88,000 |
| 19 | Industrial Engineering | Engineering (other) | 45.4 | 4.2% | 31.7% | $83,000 | $100,000 |
| 20 | Geography | Other | 45.4 | 1.6% | 43.0% | $50,000 | $88,000 |
| 21 | Mass Media | Other | 45.3 | 5.2% | 52.1% | $50,000 | $80,000 |
| 22 | Business Management | Other | 45.3 | 3.8% | 52.6% | $56,000 | $82,000 |
| 23 | International Affairs | Other | 45.2 | 6.1% | 45.2% | $64,000 | $90,000 |
| 24 | Public Policy and Law | Other | 45.2 | 2.2% | 45.5% | $55,000 | $80,000 |
| 25 | Engineering Technologies | Other | 45.1 | 1.7% | 44.4% | $65,000 | $104,000 |
| 26 | Political Science | Other | 45.0 | 4.5% | 48.7% | $52,000 | $100,000 |
| 27 | General Engineering | Engineering (other) | 44.9 | 4.5% | 31.1% | $75,000 | $105,000 |
| 28 | Civil Engineering | Engineering (other) | 44.8 | 2.3% | 15.6% | $75,000 | $115,000 |
| 29 | General Business | Other | 44.8 | 4.3% | 50.4% | $60,000 | $90,000 |
| 30 | English Language | Other | 44.5 | 6.1% | 48.5% | $48,000 | $76,000 |
| 31 | Miscellaneous Engineering | Engineering (other) | 44.2 | 3.7% | 26.4% | $75,000 | $105,000 |
| 32 | Art History | Arts | 43.8 | 6.7% | 45.3% | $45,000 | $91,000 |
| 33 | Ethnic Studies | Other | 43.4 | 4.9% | 49.6% | $52,000 | $90,000 |
| 34 | Miscellaneous Technologies | Other | 43.3 | 3.6% | 49.0% | $54,000 | $96,000 |
| 35 | Architecture | Other | 43.1 | 6.8% | 25.7% | $60,000 | $91,000 |
| 36 | Foreign Language | Other | 43.0 | 1.6% | 54.0% | $48,000 | $77,000 |
| 37 | Anthropology | Other | 43.0 | 7.9% | 55.3% | $45,000 | $65,000 |
| 38 | Commercial Art & Graphic Design | Arts | 42.8 | 5.7% | 37.1% | $50,000 | $80,000 |
| 39 | History | Other | 42.7 | 4.3% | 50.1% | $47,500 | $80,000 |
| 40 | Philosophy | Other | 42.0 | 5.1% | 47.1% | $52,000 | $80,000 |
| 41 | Chemistry | Other | 42.0 | 4.3% | 42.8% | $50,000 | $86,000 |
| 42 | Leisure and Hospitality | Other | 41.8 | 2.7% | 58.1% | $45,000 | $75,000 |
| 43 | Sociology | Other | 41.8 | 4.6% | 52.0% | $49,900 | $79,000 |
| 44 | Nutrition Sciences | Health | 41.5 | 4.5% | 48.3% | $50,000 | $70,000 |
| 45 | General Social Sciences | Other | 41.2 | 2.3% | 38.0% | $45,200 | $75,000 |
| 46 | Performing Arts | Arts | 41.1 | 7.0% | 63.9% | $44,000 | $75,000 |
| 47 | Pharmacy | Health | 41.1 | 5.6% | 30.5% | $40,000 | $85,000 |
| 48 | Biochemistry | Other | 41.0 | 2.7% | 42.0% | $52,000 | $100,000 |
| 49 | Liberal Arts | Other | 40.9 | 3.8% | 54.6% | $45,000 | $75,000 |
| 50 | Psychology | Other | 40.5 | 5.0% | 48.3% | $45,000 | $72,000 |
| 51 | Fine Arts | Arts | 40.4 | 7.7% | 58.9% | $45,000 | $72,000 |
| 52 | Interdisciplinary Studies | Other | 40.4 | 3.9% | 45.2% | $52,000 | $80,000 |
| 53 | Environmental Studies | Other | 40.3 | 6.3% | 50.5% | $50,000 | $80,000 |
| 54 | Miscellaneous Physical Sciences | Other | 40.2 | 2.5% | 22.5% | $60,000 | $81,000 |
| 55 | Miscellaneous Biological Science | Other | 40.2 | 4.4% | 46.9% | $46,000 | $80,000 |
| 56 | Health Services | Health | 40.1 | 3.8% | 45.1% | $50,000 | $67,000 |
| 57 | Construction Services | Other | 40.1 | 2.2% | 17.9% | $75,000 | $120,000 |
| 58 | Family and Consumer Sciences | Other | 39.8 | 4.3% | 45.6% | $48,000 | $65,000 |
| 59 | Social Services | Other | 39.7 | 1.9% | 30.1% | $43,000 | $60,000 |
| 60 | Agriculture | Other | 39.1 | 1.4% | 57.1% | $56,000 | $80,000 |
| 61 | Biology | Other | 39.0 | 4.3% | 51.1% | $45,000 | $83,000 |
| 62 | Criminal Justice | Other | 38.9 | 3.6% | 65.8% | $50,000 | $80,000 |
| 63 | Secondary Education | Other | 37.8 | 2.1% | 21.7% | $45,300 | $62,000 |
| 64 | Miscellaneous Education | Other | 37.1 | 1.1% | 24.5% | $48,000 | $60,000 |
| 65 | Animal and Plant Sciences | Other | 36.8 | 2.5% | 53.5% | $46,600 | $79,000 |
| 66 | General Education | Other | 36.3 | 2.6% | 28.1% | $45,000 | $56,000 |
| 67 | Theology and Religion | Other | 36.2 | 3.1% | 47.5% | $41,600 | $66,000 |
| 68 | Nursing | Health | 35.9 | 2.1% | 12.8% | $70,000 | $87,000 |
| 69 | Elementary Education | Other | 35.8 | 1.2% | 16.2% | $45,000 | $55,000 |
| 70 | Early Childhood Education | Other | 35.5 | 6.6% | 22.3% | $45,000 | $52,000 |
| 71 | Special Education | Other | 35.1 | 0.7% | 16.0% | $46,000 | $56,000 |
| 72 | Treatment Therapy | Health | 33.6 | 2.6% | 39.1% | $50,000 | $70,000 |
| 73 | Medical Technicians | Health | 32.1 | 6.2% | 47.0% | $62,000 | $80,000 |
How we did this study
- Job outcomes come from the Federal Reserve Bank of New York, The Labor Market for Recent College Graduates, outcomes by major. The figures are for 2024 (American Community Survey) and were released February 4, 2026. Unemployment and underemployment are for recent graduates ages 22 to 27 with a bachelor's degree or higher. Underemployment means working in a job that typically doesn't require a degree. Wages are medians for full-time workers with a bachelor's degree only: early career is ages 22 to 27, mid-career 35 to 45.
- AI exposure comes from our AI Exposure by Major 2026 study. It uses Eloundou, Manning, Mishkin and Rock's task-level exposure ratings (Science, 2024) for each occupation, weighted by the jobs graduates of each major actually hold in the Census ACS 2020–2024 microdata. We mapped each NY Fed major to Census field-of-degree codes (listed in the CSV). Where a NY Fed major spans several codes, we weighted by the number of workers.
- Enrollment comes from the National Student Clearinghouse Research Center's preliminary fall 2026 report (October 29, 2026) and Higher Ed Dive's report on it the same day.
- Groups. Computing (3 majors): computer science, computer engineering, information systems and management. Engineering (8): every other engineering major in the NY Fed list. Health (6): health services, medical technicians, nursing, nutrition sciences, pharmacy, treatment therapy. Arts (4): art history, commercial art and graphic design, fine arts, performing arts. Group exposure is weighted by workers. Group outcomes are simple averages of the majors.
- Correlations are Spearman rank correlations across all 73 majors, with tied values given average ranks.
Limitations.
- Exposure isn't job loss. It measures how much of a job's tasks AI could speed up.
- The outcomes are from 2024. They show the market these students were reacting to, not what the class of 2030 will face.
- Fields don't line up exactly. The Clearinghouse groups programs by broad field, which doesn't match the NY Fed's majors one-for-one. Its "engineering" can include computer engineering, for example.
- We can't follow individual students. The enrollment data shows fields shrinking and growing. It doesn't show that the same students moved from one to the other.
- Bachelor's-only pay understates fields where many graduates go on to graduate school, such as pharmacy and biology.
- Group averages are unweighted for outcomes, so a small major counts as much as a large one.
How to cite this study and download the data
- Dataset: 73 majors (CSV), with AI exposure, rank, unemployment, underemployment, early- and mid-career pay, graduate-degree share, study group and Census codes
- Charts for media use: exposure vs. unemployment (SVG) · four groups compared (SVG) · summary image (PNG)
Suggested citation (APA)
Howard, S. (2026, November 19). Students are leaving computer science: AI exposure and job outcomes for 73 college majors. MajorMatch.us. https://majormatch.us/computer-science-enrollment-decline-2026/
Short credit for charts and articles
Source: MajorMatch.us analysis of New York Fed outcomes by major (2024 data) and MajorMatch AI exposure scores (2026); enrollment from the National Student Clearinghouse (Oct 29, 2026). https://majormatch.us/computer-science-enrollment-decline-2026/
Data and charts are free to use under Creative Commons Attribution 4.0 (CC BY 4.0). Please link to https://majormatch.us/computer-science-enrollment-decline-2026/. For custom cuts of the data, email hello@majormatch.us.
Frequently asked questions
How much did computer science enrollment drop in 2026?
In the National Student Clearinghouse's preliminary fall 2026 count (released October 29, 2026), computer and information science enrollment fell 12.4% at four-year colleges, 12.3% at two-year colleges and 10.4% in graduate programs compared with fall 2025. The early count covers 46.0% of reporting institutions, and the final numbers are due in January 2027.
Why are students leaving computer science?
The Clearinghouse doesn't ask students why. But the job market for new CS grads is tougher than for most majors. In the New York Fed's 2024 data, 7.0% of recent computer science grads and 7.8% of recent computer engineering grads were unemployed, compared with 4.2% of all recent grads. Computing majors also score highest on our AI exposure measure.
Is computer science still a good major?
It can be, for the right student. Recent CS grads who find work do well: 19.1% are underemployed, versus 39.4% of all recent grads, and their early-career median of $87,000 is second only to computer engineering. The risk is the job search. If you like the work, CS still pays. If you mainly chose it for the salary, compare it with engineering majors first.
Is engineering safer than computer science?
On 2024 outcomes, yes. The eight non-computer engineering majors in our study average 3.6% unemployment for recent grads, against 6.9% for computing majors. Early-career pay is nearly the same ($80,000 vs. $81,333), and AI exposure is lower (46.6 vs. 54.1). Computer engineering is the exception: it pays the most but has 7.8% unemployment.
Which health majors have the best job outcomes?
Nursing stands out. It has the lowest underemployment of all 73 majors (12.8%), 2.1% unemployment and a $70,000 early-career median. Other health majors look very different: 47.0% of medical technician grads and 45.1% of health services grads work in jobs that don't need a degree.
Can I use this data in an article or class?
Yes. The CSV and charts are free under a Creative Commons Attribution 4.0 license. Please credit “MajorMatch.us, Where Students Leaving Computer Science Are Going (2026)” and link to this page.
Sources
- National Student Clearinghouse Research Center, “Total Higher Ed Enrollment Holds Steady in Preliminary Fall Enrollment Trends Report”, October 29, 2026
- Ben Unglesbee, “Undergraduate enrollment inched up this fall, while master’s dips 3.7%”, Higher Ed Dive, October 29, 2026
- Federal Reserve Bank of New York, The Labor Market for Recent College Graduates, outcomes by major (2024 data, released February 4, 2026)
- MajorMatch, AI Exposure vs. Pay by College Major: The 2026 MajorMatch Data Study, November 13, 2026
- Eloundou, T., Manning, S., Mishkin, P., & Rock, D. (2024). GPTs are GPTs: Labor market impact potential of LLMs. Science, 384(6702), 1306–1308. doi:10.1126/science.adj0998
- U.S. Census Bureau, American Community Survey 2020–2024 5-Year Public Use Microdata Sample