Quick answer
The better a job pays, the more of its work AI can speed up. Across 796 U.S. occupations, the best-paid fifth of jobs scores 46 out of 100 on AI exposure, against 18 for the lowest-paid fifth. College graduates feel this most. The jobs they hold score 43, compared with 24 for workers with a high school diploma or less. By major, computing and math-heavy fields are the most exposed. Nursing and other hands-on health fields are the least exposed, and many of them still pay well. Exposure means AI can do or speed up a task. It is not a forecast of job losses.
Most talk about AI and jobs is guesswork. Will it hit truck drivers or lawyers? Coders or nurses? We wanted an answer families can check. So we took one of the best-known published measures of how much of each job generative AI could speed up, and joined it to two federal datasets: what each occupation pays, and which jobs graduates of each college major actually hold. The result is a score for 151 majors, built only from public data. The method, the mapping rules and the datasets are published below.
What did the 2026 study find?
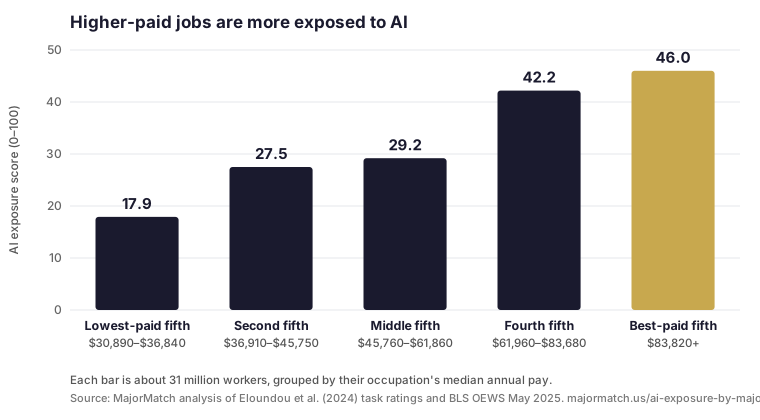
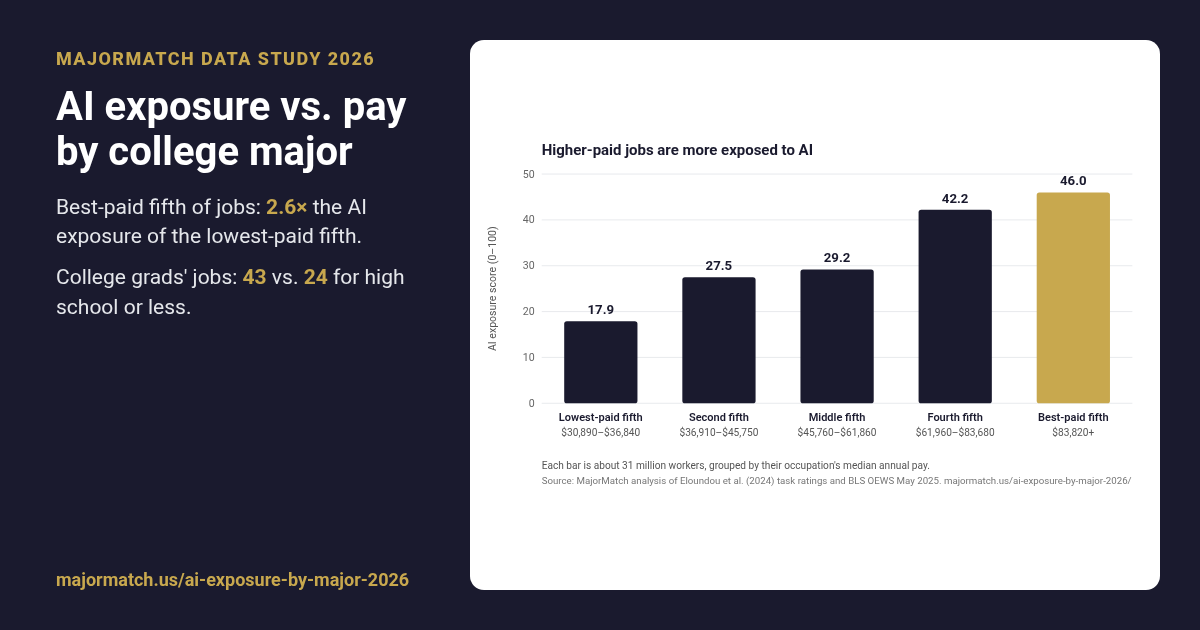
- The best-paid fifth of U.S. jobs (median pay $83,820 and up) scores 46 out of 100 on AI exposure, about 2.6 times the 18 scored by the lowest-paid fifth.
- Jobs held by college graduates score 43 on AI exposure, versus 24 for workers with a high school diploma or less: 1.8 times as exposed.
- Computer science (54.7) and computer engineering (54.6) top our list of 151 majors. About two in three of their graduates (66% and 67%) work in high-exposure jobs, meaning a score of 50 or more out of 100 (tasks that need extra software on top of the AI model count as half).
- Nursing graduates earn a median $93,400 working full time, yet only 5.5% work in high-exposure jobs. Nursing, therapy and pre-med land in the least-exposed quarter on both AI measures we tested.
- Math and money majors (actuarial science, accounting, finance, statistics, economics) are in the most-exposed quarter on both measures. Computer science is not: the second measure ranks it #93 of 151.
Do higher-paying jobs have more AI exposure?
Yes, and the gap is large. We ranked 796 U.S. occupations by median pay (BLS, May 2025) and split their 153.7 million workers into five equal-sized groups. Jobs in the lowest-paid fifth, where median pay tops out at $36,840, score 17.9 on AI exposure. Jobs in the best-paid fifth, from $83,820 up, score 46.0. That's about 2.6 times as much.
The pattern isn't perfectly smooth. Exposure climbs from 18.5 in jobs paying $40,000 or less to 48.8 in the $100,000–$150,000 band, then dips to 44.8 above $150,000. The top band mixes managers and lawyers (managers alone are 55% of its jobs) with physicians, dentists and pilots, whose hands-on work scores much lower: 23.8 for general dentists, 29.0 for airline pilots and 40.6 for family medicine physicians. Those jobs pull the average down. Across all occupations, the rank correlation between pay and exposure is 0.47. That's a solid relationship but far from a rule. Some highly exposed jobs pay less than the national median of $50,980, such as data entry keyers (69.6, median $41,340) and correspondence clerks (84.8, median $46,800).
That's different from earlier waves of automation, which mostly hit routine factory and clerical work. Generative AI is best at writing, coding, analysis and summarizing, and those tasks fill the days of many well-paid office jobs.
Are college graduates more exposed to AI than other workers?
Yes. Using 5.85 million Census survey records for employed adults aged 25 to 64, we scored the jobs people actually hold by education level:
- High school diploma or less: 23.9
- Some college or an associate degree: 34.2
- Bachelor's degree or higher: 43.0 (bachelor's only 43.2, graduate degree 42.6)
- All workers: 34.8
College graduates' jobs are 1.8 times as exposed as the jobs of workers with a high school diploma or less. Put another way, 30.9% of working college graduates are in high-exposure jobs (a score of 50 or more), compared with 18.3% of workers without a bachelor's degree. The gap holds on our second measure too (see below). That doesn't make a degree a bad bet. The median full-time worker with a degree in our sample earns $90,400. It does mean the people most likely to have AI change their daily work are the ones with diplomas.
Which college majors are most exposed to AI?
We scored each major by the jobs its graduates hold today, using Census data on 2.56 million workers aged 25 to 64. The ten most exposed:
- Computer Science: exposure 54.7, 66% of grads in high-exposure jobs, median earnings $125,900. Most common jobs: Software Developers; Other Managers; Computer and Information Systems Managers.
- Computer Engineering: exposure 54.6, 67% of grads in high-exposure jobs, median earnings $136,400. Most common jobs: Software Developers; Other Managers; Computer and Information Systems Managers.
- Computer and Information Systems: exposure 52.3, 62% of grads in high-exposure jobs, median earnings $103,600. Most common jobs: Software Developers; Computer Occupations, All Other; Computer and Information Systems Managers.
- Computer Programming and Data Processing: exposure 52.2, 59% of grads in high-exposure jobs, median earnings $95,000. Most common jobs: Software Developers; Computer Programmers; Other Managers.
- Information Sciences: exposure 52.2, 60% of grads in high-exposure jobs, median earnings $111,700. Most common jobs: Software Developers; Other Managers; Computer and Information Systems Managers.
- Management Information Systems and Statistics: exposure 51.1, 55% of grads in high-exposure jobs, median earnings $114,900. Most common jobs: Software Developers; Computer and Information Systems Managers; Other Managers.
- Computer Administration Management and Security: exposure 51.1, 62% of grads in high-exposure jobs, median earnings $99,500. Most common jobs: Information Security Analysts; Software Developers; Computer Occupations, All Other.
- Applied Mathematics: exposure 51.0, 53% of grads in high-exposure jobs, median earnings $123,300. Most common jobs: Software Developers; Other Mathematical Science Occupations; Postsecondary Teachers.
- Actuarial Science: exposure 50.9, 67% of grads in high-exposure jobs, median earnings $116,800. Most common jobs: Actuaries; Other Mathematical Science Occupations; Management Analysts.
- Statistics and Decision Science: exposure 50.3, 53% of grads in high-exposure jobs, median earnings $119,300. Most common jobs: Other Mathematical Science Occupations; Software Developers; Other Managers.
Computing dominates. Software developers are the most common job for graduates of the top five majors (the job scores 65.8), and related jobs score higher still: 74.6 for software QA testers and 81.7 for computer programmers. These are also some of the best-paid majors in the study. Computer engineering grads earn a median $136,400. Exposure here means AI tools can draft, test and debug a lot of code. It doesn't mean the jobs are gone.
Which college majors are least exposed to AI?
- Medical Assisting Services: exposure 26.6, 11% of grads in high-exposure jobs, median earnings $78,700. Most common jobs: Dental Hygienists; Physician Assistants; Medical Assistants.
- Cosmetology Services and Culinary Arts: exposure 31.5, 16% of grads in high-exposure jobs, median earnings $60,900. Most common jobs: Chefs and Head Cooks; Cooks; Food Service Managers.
- Treatment Therapy Professions: exposure 33.6, 10% of grads in high-exposure jobs, median earnings $85,500. Most common jobs: Physical Therapists; Occupational Therapists; Other Healthcare Practitioners and Technical Occupations.
- Medical Technologies Technicians: exposure 34.6, 18% of grads in high-exposure jobs, median earnings $85,500. Most common jobs: Clinical Laboratory Technologists and Technicians; Radiologic Technologists and Technicians; Other Life Scientists.
- Special Needs Education: exposure 35.1, 9% of grads in high-exposure jobs, median earnings $68,200. Most common jobs: Special Education Teachers; Elementary and Middle School Teachers; Secondary School Teachers.
- Early Childhood Education: exposure 35.5, 12% of grads in high-exposure jobs, median earnings $58,900. Most common jobs: Elementary and Middle School Teachers; Preschool and Kindergarten Teachers; Education and Childcare Administrators.
- Counseling Psychology: exposure 35.6, 13% of grads in high-exposure jobs, median earnings $66,000. Most common jobs: Educational, Guidance, and Career Counselors and Advisors; Counselors, All Other; Mental Health Counselors.
- Physical and Health Education Teaching: exposure 35.8, 14% of grads in high-exposure jobs, median earnings $72,600. Most common jobs: Elementary and Middle School Teachers; Secondary School Teachers; Education and Childcare Administrators.
- Elementary Education: exposure 35.8, 11% of grads in high-exposure jobs, median earnings $64,800. Most common jobs: Elementary and Middle School Teachers; Preschool and Kindergarten Teachers; Education and Childcare Administrators.
- Teacher Education: Multiple Levels: exposure 35.8, 11% of grads in high-exposure jobs, median earnings $63,000. Most common jobs: Elementary and Middle School Teachers; Secondary School Teachers; Preschool and Kindergarten Teachers.
Two groups make up the bottom of the list. Hands-on health majors (medical assisting, physical and occupational therapy, medical technology, nursing) are one. Teaching majors are the other. On our main measure, only about 31% of an elementary school teacher's tasks are exposed, because so much of the job is live, in-person work with kids. The cross-check measure disagrees about teaching, as we explain below, so treat education's low score with more caution than health's.
Which majors pay well with low AI exposure?
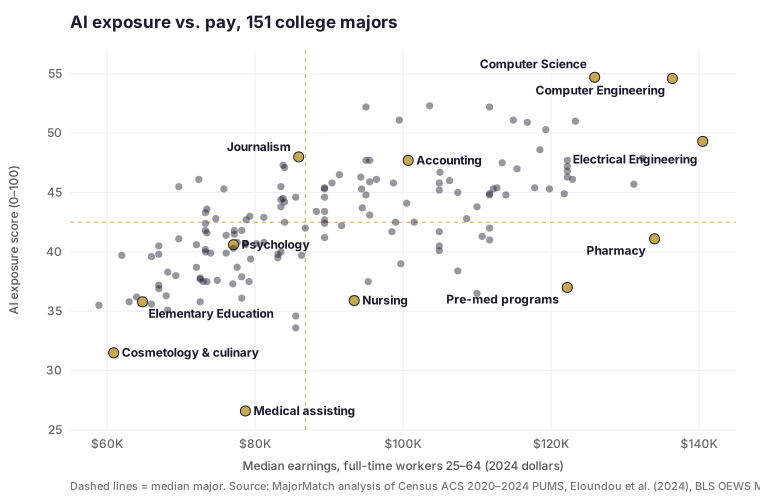
Higher-earning majors tend to be more exposed. The rank correlation across all 151 majors is 0.65. The best-paid quarter of majors (median $105,000–$140,500) averages 46.0, against 39.2 for the lowest-paid quarter. But 18 majors pay at least as much as the median major ($86,800) while scoring below the median exposure (42.5). The best-paid of them:
- Pharmacy Pharmaceutical Sciences and Administration: $134,000 median earnings, exposure 41.1 (rank 94 of 151).
- Health and Medical Preparatory Programs: $122,200 median earnings, exposure 37.0 (rank 135 of 151).
- Biochemical Sciences: $111,700 median earnings, exposure 41.0 (rank 95 of 151).
- Chemistry: $111,700 median earnings, exposure 42.0 (rank 82 of 151).
- Molecular Biology: $110,700 median earnings, exposure 41.3 (rank 91 of 151).
- Transportation Sciences and Technologies: $110,000 median earnings, exposure 36.5 (rank 137 of 151).
- Zoology: $107,400 median earnings, exposure 38.4 (rank 122 of 151).
- Industrial Production Technologies: $104,900 median earnings, exposure 41.7 (rank 87 of 151).
One honest caveat: many of these graduates earned more degrees. 76% of pre-med graduates and 66% of pharmacy graduates hold a graduate degree. Their scores reflect the licensed jobs those extra degrees lead to, such as pharmacists (41.4) and family medicine physicians (40.6). Nursing is different. Only 29% of nursing grads hold a graduate degree, and the bachelor's alone leads to Registered Nurses, the most common job in our nursing sample.
AI exposure and pay for all 151 majors
Majors use the Census Bureau's field-of-degree names. We include every field with at least 1,000 survey records (151 of 174). The ten most exposed are highlighted.
| Rank | Major | AI exposure (0–100) | Grads in high-exposure jobs | Median earnings | Cross-check rank |
|---|---|---|---|---|---|
| 1 | Computer Science | 54.7 | 66.3% | $125,900 | 93 |
| 2 | Computer Engineering | 54.6 | 67.3% | $136,400 | 77 |
| 3 | Computer and Information Systems | 52.3 | 62.4% | $103,600 | 99 |
| 4 | Information Sciences | 52.2 | 59.7% | $111,700 | 71 |
| 5 | Computer Programming and Data Processing | 52.2 | 58.7% | $95,000 | 115 |
| 6 | Computer Administration Management and Security | 51.1 | 62.2% | $99,500 | 111 |
| 7 | Management Information Systems and Statistics | 51.1 | 55.3% | $114,900 | 44 |
| 8 | Applied Mathematics | 51.0 | 53.1% | $123,300 | 6 |
| 9 | Actuarial Science | 50.9 | 66.7% | $116,800 | 1 |
| 10 | Statistics and Decision Science | 50.3 | 52.7% | $119,300 | 16 |
| 11 | Electrical Engineering | 49.3 | 58.1% | $140,500 | 90 |
| 12 | Electrical Engineering Technology | 48.6 | 55.0% | $118,500 | 121 |
| 13 | Journalism | 48.0 | 44.2% | $85,900 | 30 |
| 14 | Aerospace Engineering | 47.9 | 53.9% | $132,400 | 75 |
| 15 | Atmospheric Sciences and Meteorology | 47.7 | 49.2% | $95,000 | 48 |
| 16 | Accounting | 47.7 | 53.6% | $100,700 | 9 |
| 17 | Computer Networking and Telecommunications | 47.7 | 48.3% | $95,500 | 104 |
| 18 | Physics | 47.7 | 41.6% | $122,200 | 43 |
| 19 | Finance | 47.5 | 40.8% | $113,400 | 10 |
| 20 | Human Resources and Personnel Management | 47.3 | 43.5% | $83,800 | 4 |
| 21 | Materials Science | 47.2 | 41.7% | $122,200 | 45 |
| 22 | Advertising and Public Relations | 47.1 | 43.2% | $84,000 | 26 |
| 23 | Business Economics | 47.0 | 39.5% | $115,400 | 17 |
| 24 | Mechanical Engineering | 46.8 | 51.3% | $122,200 | 94 |
| 25 | Mathematics | 46.7 | 39.2% | $105,000 | 15 |
| 26 | Marketing and Marketing Research | 46.5 | 42.5% | $91,400 | 39 |
| 27 | Economics | 46.3 | 36.4% | $122,200 | 18 |
| 28 | International Business | 46.3 | 39.3% | $94,300 | 35 |
| 29 | Engineering Mechanics Physics and Science | 46.1 | 45.0% | $122,900 | 102 |
| 30 | Operations Logistics and E-Commerce | 46.1 | 39.3% | $96,400 | 52 |
| 31 | Composition and Rhetoric | 46.1 | 38.9% | $72,400 | 54 |
| 32 | International Relations | 46.0 | 33.1% | $106,300 | 7 |
| 33 | Engineering Technologies | 45.9 | 45.7% | $95,500 | 124 |
| 34 | Cognitive Science and Biopsychology | 45.8 | 34.3% | $104,900 | 42 |
| 35 | Environmental Engineering | 45.8 | 40.0% | $98,700 | 65 |
| 36 | Geology and Earth Science | 45.8 | 40.0% | $90,400 | 86 |
| 37 | Chemical Engineering | 45.7 | 35.5% | $131,200 | 47 |
| 38 | Communications | 45.5 | 38.5% | $83,500 | 41 |
| 39 | Miscellaneous Fine Arts | 45.5 | 37.9% | $69,700 | 118 |
| 40 | Industrial and Manufacturing Engineering | 45.4 | 39.4% | $117,800 | 83 |
| 41 | Geography | 45.4 | 39.6% | $89,400 | 105 |
| 42 | Biomedical Engineering | 45.4 | 38.2% | $112,700 | 66 |
| 43 | Business Management and Administration | 45.3 | 37.8% | $89,400 | 51 |
| 44 | Mass Media | 45.3 | 37.0% | $75,800 | 92 |
| 45 | Engineering and Industrial Management | 45.3 | 37.4% | $112,200 | 91 |
| 46 | Materials Engineering and Materials Science | 45.3 | 37.6% | $119,800 | 64 |
| 47 | Industrial and Organizational Psychology | 45.3 | 35.2% | $94,400 | 25 |
| 48 | Public Policy | 45.2 | 29.4% | $104,900 | 12 |
| 49 | Political Science and Government | 45.0 | 27.9% | $107,400 | 8 |
| 50 | Petroleum Engineering | 44.9 | 45.7% | $121,800 | 98 |
| 51 | General Engineering | 44.9 | 41.1% | $111,700 | 109 |
| 52 | General Business | 44.8 | 36.4% | $95,000 | 70 |
| 53 | Architectural Engineering | 44.8 | 26.8% | $111,700 | 84 |
| 54 | Civil Engineering | 44.8 | 22.9% | $113,900 | 80 |
| 55 | Pre-Law and Legal Studies | 44.6 | 25.3% | $85,500 | 13 |
| 56 | Miscellaneous Business and Medical Administration | 44.6 | 34.8% | $89,400 | 79 |
| 57 | Linguistics and Comparative Language and Literature | 44.5 | 33.0% | $83,800 | 37 |
| 58 | English Language and Literature | 44.4 | 30.8% | $83,500 | 22 |
| 59 | Intercultural and International Studies | 44.2 | 30.9% | $84,000 | 33 |
| 60 | Miscellaneous Engineering Technologies | 44.1 | 37.4% | $100,500 | 125 |
| 61 | Art History and Criticism | 43.8 | 29.7% | $83,500 | 61 |
| 62 | Miscellaneous Engineering | 43.8 | 36.2% | $110,000 | 119 |
| 63 | Miscellaneous Social Sciences | 43.7 | 31.0% | $94,500 | 38 |
| 64 | Health and Medical Administrative Services | 43.6 | 35.1% | $73,500 | 49 |
| 65 | Area Ethnic and Civilization Studies | 43.4 | 28.6% | $89,400 | 29 |
| 66 | Public Administration | 43.4 | 32.0% | $88,300 | 81 |
| 67 | Communication Technologies | 43.3 | 30.7% | $73,300 | 138 |
| 68 | Architecture | 43.1 | 17.2% | $95,500 | 113 |
| 69 | Anthropology and Archeology | 43.0 | 30.9% | $79,300 | 63 |
| 70 | Other Foreign Languages | 42.9 | 29.8% | $81,200 | 62 |
| 71 | Genetics | 42.8 | 23.5% | $108,600 | 68 |
| 72 | Commercial Art and Graphic Design | 42.8 | 24.2% | $74,700 | 122 |
| 73 | Environmental Science | 42.7 | 30.2% | $78,800 | 106 |
| 74 | History | 42.7 | 26.2% | $89,400 | 40 |
| 75 | Agricultural Economics | 42.5 | 31.1% | $101,500 | 103 |
| 76 | French German Latin and Other Common Foreign Language Studies | 42.5 | 25.5% | $84,000 | 28 |
| 77 | Biological Engineering | 42.5 | 32.3% | $99,000 | 114 |
| 78 | Miscellaneous Biology | 42.4 | 26.7% | $89,400 | 107 |
| 79 | Film Video and Photographic Arts | 42.4 | 27.8% | $73,300 | 130 |
| 80 | Food Science | 42.2 | 32.2% | $91,700 | 110 |
| 81 | Philosophy and Religious Studies | 42.0 | 24.3% | $86,800 | 31 |
| 82 | Chemistry | 42.0 | 21.1% | $111,700 | 95 |
| 83 | Hospitality Management | 41.8 | 27.8% | $73,300 | 112 |
| 84 | Humanities | 41.8 | 27.6% | $77,200 | 72 |
| 85 | Sociology | 41.8 | 27.3% | $78,200 | 59 |
| 86 | Mechanical Engineering Related Technologies | 41.7 | 43.3% | $98,500 | 139 |
| 87 | Industrial Production Technologies | 41.7 | 32.7% | $104,900 | 137 |
| 88 | Community and Public Health | 41.6 | 29.4% | $73,500 | 78 |
| 89 | Nutrition Sciences | 41.5 | 37.6% | $77,200 | 76 |
| 90 | Ecology | 41.4 | 24.3% | $76,100 | 108 |
| 91 | Molecular Biology | 41.3 | 19.6% | $110,700 | 82 |
| 92 | Neuroscience | 41.2 | 21.9% | $89,400 | 87 |
| 93 | Drama and Theater Arts | 41.1 | 26.6% | $69,700 | 101 |
| 94 | Pharmacy Pharmaceutical Sciences and Administration | 41.1 | 10.8% | $134,000 | 117 |
| 95 | Biochemical Sciences | 41.0 | 18.8% | $111,700 | 97 |
| 96 | Liberal Arts | 40.8 | 26.8% | $77,600 | 89 |
| 97 | Communication Disorders Sciences and Services | 40.8 | 10.8% | $81,200 | 3 |
| 98 | Miscellaneous Psychology | 40.7 | 21.8% | $80,200 | 69 |
| 99 | Natural Resources Management | 40.7 | 23.8% | $78,700 | 133 |
| 100 | General Social Sciences | 40.6 | 25.4% | $78,700 | 67 |
| 101 | Psychology | 40.6 | 22.8% | $77,100 | 55 |
| 102 | Fine Arts | 40.6 | 23.2% | $72,100 | 120 |
| 103 | Microbiology | 40.5 | 20.9% | $104,900 | 96 |
| 104 | Multi/Interdisciplinary Studies | 40.5 | 25.6% | $67,000 | 46 |
| 105 | Criminology | 40.3 | 24.3% | $77,100 | 127 |
| 106 | Interdisciplinary Social Sciences | 40.2 | 23.9% | $73,300 | 74 |
| 107 | Construction Services | 40.1 | 12.2% | $104,900 | 132 |
| 108 | Music | 40.0 | 21.8% | $73,300 | 88 |
| 109 | Agriculture Production and Management | 40.0 | 27.2% | $83,500 | 140 |
| 110 | Miscellaneous Education | 39.9 | 22.8% | $76,100 | 56 |
| 111 | Educational Psychology | 39.9 | 12.3% | $74,000 | 24 |
| 112 | Educational Administration and Supervision | 39.8 | 10.5% | $83,100 | 2 |
| 113 | Family and Consumer Sciences | 39.8 | 24.2% | $67,000 | 58 |
| 114 | Human Services and Community Organization | 39.7 | 23.4% | $62,000 | 60 |
| 115 | Multi-Disciplinary or General Science | 39.7 | 24.6% | $86,300 | 123 |
| 116 | Studio Arts | 39.6 | 21.4% | $66,000 | 131 |
| 117 | Forestry | 39.5 | 18.8% | $83,100 | 148 |
| 118 | Clinical Psychology | 39.4 | 16.3% | $79,400 | 50 |
| 119 | Biology | 39.0 | 18.1% | $99,700 | 116 |
| 120 | Criminal Justice and Fire Protection | 38.7 | 22.9% | $77,600 | 143 |
| 121 | Miscellaneous Health Medical Professions | 38.7 | 30.1% | $72,100 | 85 |
| 122 | Zoology | 38.4 | 18.2% | $107,400 | 128 |
| 123 | Visual and Performing Arts | 38.3 | 20.1% | $68,200 | 126 |
| 124 | Language and Drama Education | 38.0 | 14.8% | $69,300 | 11 |
| 125 | Plant Science and Agronomy | 37.9 | 23.9% | $78,200 | 149 |
| 126 | Social Science or History Teacher Education | 37.8 | 14.4% | $72,600 | 27 |
| 127 | Mathematics Teacher Education | 37.7 | 13.0% | $72,600 | 5 |
| 128 | Science and Computer Teacher Education | 37.6 | 13.4% | $74,900 | 21 |
| 129 | Physical Fitness Parks Recreation and Leisure | 37.5 | 21.4% | $73,500 | 135 |
| 130 | Secondary Teacher Education | 37.5 | 14.0% | $73,000 | 20 |
| 131 | General Medical and Health Services | 37.5 | 21.0% | $79,200 | 129 |
| 132 | Physiology | 37.5 | 15.8% | $95,300 | 134 |
| 133 | General Agriculture | 37.3 | 21.8% | $77,000 | 145 |
| 134 | Social Work | 37.2 | 14.8% | $67,000 | 57 |
| 135 | Health and Medical Preparatory Programs | 37.0 | 12.2% | $122,200 | 136 |
| 136 | Art and Music Education | 36.9 | 12.8% | $67,000 | 23 |
| 137 | Transportation Sciences and Technologies | 36.5 | 20.1% | $110,000 | 150 |
| 138 | General Education | 36.3 | 12.5% | $68,000 | 34 |
| 139 | Theology and Religious Vocations | 36.2 | 17.8% | $64,000 | 73 |
| 140 | Animal Sciences | 36.1 | 19.8% | $78,200 | 146 |
| 141 | Nursing | 35.9 | 5.5% | $93,400 | 144 |
| 142 | Teacher Education: Multiple Levels | 35.8 | 11.3% | $63,000 | 14 |
| 143 | Elementary Education | 35.8 | 11.3% | $64,800 | 19 |
| 144 | Physical and Health Education Teaching | 35.8 | 13.7% | $72,600 | 100 |
| 145 | Counseling Psychology | 35.6 | 12.7% | $66,000 | 32 |
| 146 | Early Childhood Education | 35.5 | 12.3% | $58,900 | 53 |
| 147 | Special Needs Education | 35.1 | 8.7% | $68,200 | 36 |
| 148 | Medical Technologies Technicians | 34.6 | 18.0% | $85,500 | 142 |
| 149 | Treatment Therapy Professions | 33.6 | 10.3% | $85,500 | 147 |
| 150 | Cosmetology Services and Culinary Arts | 31.5 | 16.5% | $60,900 | 151 |
| 151 | Medical Assisting Services | 26.6 | 10.6% | $78,700 | 141 |
Do the two main AI exposure measures agree?
Partly, and we think you should know where they don't. Our main score uses Eloundou et al.'s task ratings. To test it, we rebuilt every major's score with a widely cited alternative: Felten, Raj and Seamans' Language-Modeling AI Occupational Exposure (AIOE). That measure links AI to the abilities a job needs, not to its task list.
- For occupations, the two agree well. Across 668 matched occupations the rank correlation is 0.877. Both find that higher-paid jobs are more exposed (0.449 vs. 0.488 rank correlation with pay).
- Both find college graduates' jobs far more exposed than jobs held by workers with a high school diploma or less.
- Both put the same majors at the extremes. In the most-exposed quarter on both: Applied Mathematics, Actuarial Science, Statistics and Decision Science, Journalism, Accounting, Finance, Human Resources and Personnel Management, Advertising and Public Relations, Business Economics, Mathematics, Economics, International Business, International Relations. In the least-exposed quarter on both: Medical Assisting Services, Cosmetology Services and Culinary Arts, Treatment Therapy Professions, Medical Technologies Technicians, Nursing, Animal Sciences, Transportation Sciences and Technologies, Health and Medical Preparatory Programs, General Agriculture, Physiology, General Medical and Health Services, Physical Fitness Parks Recreation and Leisure, and others.
- For majors overall, they diverge. The rank correlation between the two major scores is only 0.29. The ability measure rates teaching, counseling and social work as highly exposed and rates software work lower, so it ranks computer science #93 and elementary education #19. Under that measure, the link between a major's pay and its exposure disappears (rank correlation 0.0).
Our takeaway: the findings about pay level, education and the two extremes (math-and-money majors at the top, hands-on health majors at the bottom) are solid on both measures. Where a specific major ranks in the middle depends on which measure you trust. We lead with the task-based score because it rates each task for a specific speedup by modern language models, and it's the same measure behind the MajorMatch AI-exposure numbers elsewhere on this site. The CSV includes the cross-check rank for every major so you can compare.
What does an AI exposure score actually mean?
An exposure score of 50 means that, for a typical worker in that job, half the task weight could be done at least twice as fast at the same quality by a GPT-4-class model. A task the model can speed up on its own counts in full. A task that needs extra software built on top of the model counts as half. So a score of 50 can mean half the tasks fully exposed, or more of them partly exposed. It describes what AI could speed up. It doesn't say what employers will do. A highly exposed job might shrink, or it might stay the same size while each worker gets more done. Economists still don't know which way most jobs will go. Exposure is the right first question to ask, not the last.
For a student, the useful question is which tasks in your future job AI will take over, and which ones will still need you. Majors with high exposure and high pay (computing, finance, math) will likely reward people who use AI well. Majors with low exposure (health care, skilled hands-on work) are less likely to see daily work change quickly.
How we built this study
- Task exposure by occupation. We use the occupation-level file from Eloundou, Manning, Mishkin & Rock, “GPTs are GPTs” (Science, 2024; ratings collected in 2023 on O*NET tasks). The score is their β measure (share of tasks rated directly exposed, plus half of tasks exposed with extra tools). We average the GPT-4 and human-expert ratings, then average O*NET sub-occupations into 6-digit SOC 2018 codes.
- Pay and employment. BLS Occupational Employment and Wage Statistics (OEWS), national estimates for May 2025, 830 detailed occupations. 771 match a task score exactly. 29 that BLS publishes as aggregates get the average of the O*NET occupations inside them (for example, home health and personal care aides 31-1120 = 31-1121 + 31-1122). The rest are mostly “all other” catch-alls with no task data. Matched occupations cover 98.9% of U.S. employment. Five performer jobs with hourly-only BLS pay are left out of pay comparisons, which leaves 796 occupations and 153.7 million jobs. Pay fifths are formed by sorting occupations by median annual wage and cutting at every 20% of employment. Averages are weighted by employment.
- Majors to jobs. U.S. Census Bureau American Community Survey 2020–2024 5-year Public Use Microdata Sample (released January 2026). We keep employed civilians aged 25–64 with a bachelor's degree or higher and group them by their first-listed bachelor's field (FOD1P). Each person's occupation (SOCP) gets a score: an exact SOC match where one exists, the BLS-employment-weighted average of the detailed occupations inside the Census code where the Census groups occupations (for example, code 1520XX, “other mathematical science occupations”), or the task score directly where BLS only publishes an aggregate. Ten Census “all other” codes (0.5% of graduates) have no score and are dropped. A major's score is the survey-weighted average across its graduates. “High-exposure job” means a score of 50+, “low” means under 20.
- Earnings. Survey-weighted median of total earnings (PERNP, adjusted to 2024 dollars with ADJINC) for full-time, year-round workers (35+ hours a week, 50+ weeks a year, positive earnings) aged 25–64 in each major, including graduate-degree holders. Rounded to the nearest $100. The CSV also has bachelor's-only earnings and exposure. Bachelor's-only and all-degree exposure scores rank majors almost identically (rank correlation 0.978).
- Coverage. 151 of 174 Census fields have at least 1,000 records. Together they hold 2,556,322 records representing 54.0 million workers.
- Cross-check. We repeated the major and education results with Felten, Raj & Seamans' Language-Modeling AIOE (2023), matched on SOC codes the same way.
What this data can't tell you
- Exposure isn't job loss. These scores measure what AI could speed up, not layoffs, hiring or wages.
- The ratings are from 2023. AI tools have improved since GPT-4, especially at multi-step “agent” work, so true exposure today is probably higher in many jobs. The ratings show relative exposure, not a current absolute level.
- Majors are measured by past graduates. The jobs held by today's 25-to-64-year-olds may not be the jobs a 2030 graduate gets.
- Grad school is mixed in. A biology major's score includes the many biology grads who became doctors. Use the bachelor's-only columns in the CSV for a cleaner view.
- Measures disagree for middle-ranked majors. See the cross-check. Treat any single rank as approximate.
- Correlation, not cause. Majors differ in who enrolls, where they live and much else.
- Coarse job codes. Some Census codes, like “other managers,” are broad, and we give them an average score.
How to cite this study and download the data
- Majors dataset: 151 majors (CSV), with exposure, share in high- and low-exposure jobs, earnings (all and bachelor's-only), graduate-degree share, cross-check rank, top 3 jobs and sample sizes
- Occupations dataset: 800 occupations (CSV), with exposure (combined, GPT-4 rater and human raters), May 2025 median pay and employment
- Summary dataset (CSV): every headline figure on this page (pay fifths, pay bands, education groups, major pay quarters, correlations)
- Codebook (TXT): column definitions, sources and vintages for all three files
- Charts for media use: exposure by pay level (SVG) · majors, exposure vs. pay (SVG) · summary image (PNG)
Suggested citation (APA)
Howard, S. (2026, November 13). AI exposure vs. pay by college major: The 2026 MajorMatch data study. MajorMatch.us. https://majormatch.us/ai-exposure-by-major-2026/
Short credit for charts and articles
Source: MajorMatch.us, AI Exposure vs. Pay by College Major (2026), analysis of U.S. Census Bureau ACS, BLS OEWS and Eloundou et al. (2024) data. https://majormatch.us/ai-exposure-by-major-2026/
Data and charts are free to use under Creative Commons Attribution 4.0 (CC BY 4.0). Please link to https://majormatch.us/ai-exposure-by-major-2026/. Journalists, counselors and researchers: for custom cuts (a single major, a state, early-career only), email hello@majormatch.us.
Frequently asked questions
Which college majors are most exposed to AI?
In our study of 151 majors, computer science (54.7 out of 100) and computer engineering (54.6) are the most exposed, followed by other computing fields, applied math, actuarial science and statistics. The score is based on the jobs graduates actually hold. About two-thirds of computer science graduates work in high-exposure jobs, meaning a score of 50 or more out of 100 (tasks that need extra software on top of the AI model count as half).
Which college majors are least exposed to AI?
Medical assisting services (26.6), cosmetology and culinary arts, therapy professions such as physical and occupational therapy, medical technology, and the education majors score lowest. Nursing (35.9) is close behind. Hands-on health majors are in the least-exposed quarter on both AI measures we tested.
Does high AI exposure mean a job will be replaced?
No. Exposure measures how much of a job's task list AI could do or speed up at least twice as fast. It doesn't measure whether employers will cut those jobs. Many highly exposed jobs pay well above the national median of {d(O['national_median_wage'])}: software developers earn a median {d(O['named']['15-1252']['wage'])} and accountants {d(O['named']['13-2011']['wage'])}. AI often speeds up part of the work without removing the role.
Do higher-paying jobs have more AI exposure?
Yes, on average. The best-paid fifth of U.S. jobs (median pay $83,820 and up) scores 46.0 on AI exposure, against 17.9 for the lowest-paid fifth (up to $36,840). Exposure peaks in the $100,000–$150,000 pay band (48.8) and dips a little above $150,000 (44.8), because hands-on jobs like physicians, dentists and pilots score low.
Is computer science still a good major with AI?
Computer science is both the most AI-exposed major in our study and one of the best-paid ($125,900 median full-time earnings). The two AI measures we tested disagree sharply about it: the task-based measure we use ranks it #1, while the Felten-Raj-Seamans ability-based measure ranks it #93 of 151. Expect the work to change. The data doesn't show that the degree has stopped paying.
Is nursing safe from AI?
Nursing is one of the least AI-exposed majors on both measures we tested (#141 of 151 on our main score, #144 on the cross-check). Only 5.5% of nursing graduates work in high-exposure jobs, and the median full-time nursing graduate earns $93,400. No job is fully safe from change, but most nursing work is hands-on patient care.
How is the AI exposure score calculated?
For each occupation we use Eloundou, Manning, Mishkin and Rock's task ratings (published in Science, 2024). The score is the share of the job's tasks that a GPT-4-class model could do at least twice as fast at the same quality, with tasks that need extra software counted as half. GPT-4 and human expert ratings are averaged. For each major, we average the scores of the jobs its graduates hold, weighted by Census survey weights (ACS 2020–2024).
Can I use this data in my article or class?
Yes. All three CSV files are free under a Creative Commons Attribution 4.0 license. Please credit “MajorMatch.us, AI Exposure vs. Pay by College Major (2026)” and link to this page. For custom cuts of the data, email hello@majormatch.us.
Sources
- Eloundou, T., Manning, S., Mishkin, P., & Rock, D. (2024). GPTs are GPTs: Labor market impact potential of LLMs. Science, 384(6702), 1306–1308. doi:10.1126/science.adj0998 (preprint arXiv:2303.10130). Occupation-level data: github.com/openai/GPTs-are-GPTs
- U.S. Bureau of Labor Statistics, Occupational Employment and Wage Statistics, national estimates, May 2025
- U.S. Census Bureau, American Community Survey 2020–2024 5-Year Public Use Microdata Sample (released January 2026)
- Felten, E., Raj, M., & Seamans, R. (2023). How will language modelers like ChatGPT affect occupations and industries? Language-Modeling AIOE data: github.com/AIOE-Data/AIOE. Original AIOE: Strategic Management Journal 42(12), 2021
- O*NET (U.S. Department of Labor, Employment and Training Administration): occupation task lists underlying the Eloundou et al. ratings