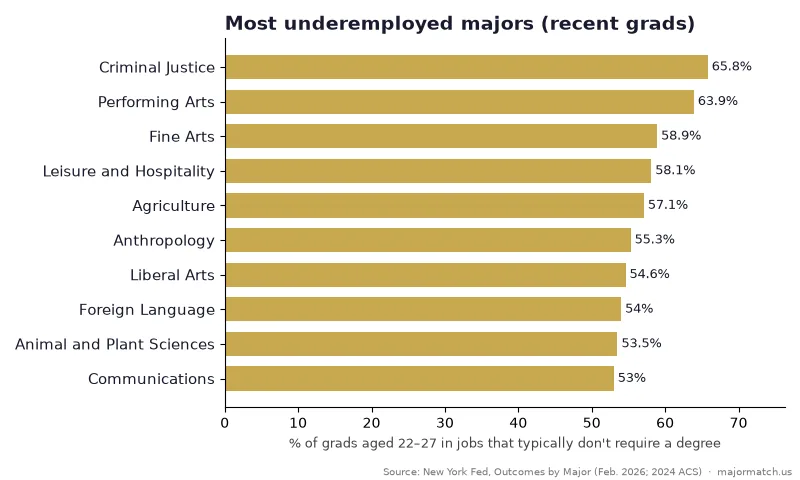
Quick answer: The majors with the highest underemployment are criminal justice (65.8%), performing arts (63.9%), fine arts (58.9%), leisure and hospitality (58.1%) and agriculture (57.1%), per the New York Fed's February 2026 outcomes-by-major table. The lowest are nursing (12.8%), aerospace engineering (14.7%), civil engineering (15.6%), computer engineering (15.8%) and special education (16.0%). Across all majors, 39.4% of recent grads are underemployed.
Here's a scene a lot of families know. The graduation photos are on the fridge. Six months later, your kid is working the same retail job they had in high school, just with more hours and a loan statement. Nobody says it out loud, but everyone is thinking it: was that degree supposed to lead somewhere?
Economists have a word for this. Underemployment means a college grad is working a job that typically doesn't require a degree. And it isn't rare. The New York Fed puts it at 39.4% of recent grads across all majors in its newest by-major table. But the average hides a huge spread, from about one in eight grads in nursing to about two in three in criminal justice.
This ranking puts all 73 majors the New York Fed tracks in order, from most to least underemployed. It won't tell your teen what to study. It will tell you which majors need a plan B on day one, and which ones mostly lead straight into degree-level jobs.
What does "underemployed" actually mean here?
The New York Fed counts a recent graduate (age 22 to 27, with a bachelor's degree or higher, not currently in school) as underemployed when they work in a job that typically doesn't require a college degree. To decide which jobs count, it uses the U.S. Department of Labor's O*NET surveys: if fewer than half of the people in a job say a bachelor's degree is needed, it's a non-college job.
Our ranking uses one number, the underemployment rate for recent grads, from the New York Fed's Labor Market for Recent College Graduates outcomes-by-major table, released February 4, 2026, and built on 2024 American Community Survey data. We also show each major's unemployment rate and median pay so you can see the whole trade-off. We didn't adjust, weight or blend anything. If you want the trade-offs scored for your own kid, that's what the assessment is for.
One note on the headline numbers: the New York Fed's quarterly series, which uses a different survey, had recent-grad underemployment at about 42% in the second quarter of 2026. The by-major table below is the annual 2024 snapshot, so its all-majors figure is 39.4%. Both are real; they just measure slightly different windows.
Which majors have the highest underemployment rate?
| Rank | Major | Underemployment | Unemployment | Early-career pay (22–27) | Mid-career pay (35–45) |
|---|---|---|---|---|---|
| 1 | Criminal Justice | 65.8% | 3.6% | $50,000 | $80,000 |
| 2 | Performing Arts | 63.9% | 7.0% | $44,000 | $75,000 |
| 3 | Fine Arts | 58.9% | 7.7% | $45,000 | $72,000 |
| 4 | Leisure and Hospitality | 58.1% | 2.7% | $45,000 | $75,000 |
| 5 | Agriculture | 57.1% | 1.4% | $56,000 | $80,000 |
| 6 | Anthropology | 55.3% | 7.9% | $45,000 | $65,000 |
| 7 | Liberal Arts | 54.6% | 3.8% | $45,000 | $75,000 |
| 8 | Foreign Language | 54.0% | 1.6% | $48,000 | $77,000 |
| 9 | Animal and Plant Sciences | 53.5% | 2.5% | $46,600 | $79,000 |
| 10 | Communications | 53.0% | 3.9% | $52,000 | $88,000 |
| 11 | Business Management | 52.6% | 3.8% | $56,000 | $82,000 |
| 12 | Mass Media | 52.1% | 5.2% | $50,000 | $80,000 |
| 13 | Sociology | 52.0% | 4.6% | $49,900 | $79,000 |
| 14 | Biology | 51.1% | 4.3% | $45,000 | $83,000 |
| 15 | Environmental Studies | 50.5% | 6.3% | $50,000 | $80,000 |
| 16 | General Business | 50.4% | 4.3% | $60,000 | $90,000 |
| 17 | History | 50.1% | 4.3% | $47,500 | $80,000 |
| 18 | Ethnic Studies | 49.6% | 4.9% | $52,000 | $90,000 |
| 19 | Marketing | 49.3% | 4.4% | $60,000 | $100,000 |
| 20 | Miscellaneous Technologies | 49.0% | 3.6% | $54,000 | $96,000 |
| — | All majors | 39.4% | 4.2% | $58,000 | $87,000 |
Source: Federal Reserve Bank of New York, The Labor Market for Recent College Graduates, Outcomes by Major (released Feb. 4, 2026; 2024 American Community Survey via IPUMS). Underemployment and unemployment are for grads aged 22–27. Pay is the median for full-time workers with a bachelor's degree only.
Tap any major in the table to open its free loan-vs-upside calculator, or compare debt and lifetime earnings with your own numbers in the degree loan vs. upside calculator. Then take the assessment to see which of these majors actually fit your teen.
Why do these majors top the list?
Look at the top 20 and a pattern jumps out. Most of these degrees teach broad skills that many jobs value but few jobs require on paper. A few quick notes on the biggest names, starting with the one that surprises families most.
Criminal justice is #1, and it's not close
At 65.8%, criminal justice has the highest underemployment of any major. A likely reason: police officers, for example, need at least a high school diploma plus academy training, per the BLS, and only some departments require a college degree, so a grad who becomes a patrol officer can count as underemployed even when they're doing exactly what they trained for. Pay still climbs to a $80,000 mid-career median. If this is your teen's major, our criminal justice careers guide covers the paths that do need the degree.
Arts majors: high underemployment, high unemployment
Performing arts (63.9%) and fine arts (58.9%) pair high underemployment with unemployment near 7% (7.0% and 7.7%). For arts grads, the first few years are often a mix of creative work and a day job, and the numbers reflect it.
Agriculture: almost nobody is unemployed
Agriculture is #5 for underemployment (57.1%) but has one of the lowest unemployment rates on the whole list (1.4%). Grads are working; it's just that many of the jobs they land aren't ones O*NET classifies as needing a degree.
Business management vs. accounting
Business management lands at #11 (52.6%). Accounting, in the same business school, is down at 21.2% and finance at 27.8%. The more a degree points at one specific job, the lower its underemployment tends to be. The New York Fed's own research found the same split years ago.
Biology is a waiting room
Biology sits at #14 (51.1%). But 64.0% of working-age biology grads go on to earn a graduate degree, one of the highest shares in the table. That suggests many of those early non-degree jobs are stopgaps on the way to med school, PA school or a Ph.D., not a dead end.
Which majors have the lowest underemployment?
These 15 majors send the biggest share of grads straight into jobs that need the degree. Most are licensed or occupation-specific: you study nursing to become a nurse, elementary education to teach, civil engineering to sign off on bridges.
| Rank (lowest first) | Major | Underemployment | Unemployment | Early-career pay | Mid-career pay |
|---|---|---|---|---|---|
| 1 | Nursing | 12.8% | 2.1% | $70,000 | $87,000 |
| 2 | Aerospace Engineering | 14.7% | 2.2% | $85,000 | $130,000 |
| 3 | Civil Engineering | 15.6% | 2.3% | $75,000 | $115,000 |
| 4 | Computer Engineering | 15.8% | 7.8% | $90,000 | $131,000 |
| 5 | Special Education | 16.0% | 0.7% | $46,000 | $56,000 |
| 6 | Elementary Education | 16.2% | 1.2% | $45,000 | $55,000 |
| 7 | Chemical Engineering | 17.9% | 4.7% | $85,000 | $135,000 |
| 8 | Construction Services | 17.9% | 2.2% | $75,000 | $120,000 |
| 9 | Computer Science | 19.1% | 7.0% | $87,000 | $120,000 |
| 10 | Mechanical Engineering | 20.1% | 4.4% | $80,000 | $120,000 |
| 11 | Electrical Engineering | 21.1% | 3.2% | $82,000 | $123,000 |
| 12 | Accounting | 21.2% | 2.6% | $68,000 | $97,000 |
| 13 | Secondary Education | 21.7% | 2.1% | $45,300 | $62,000 |
| 14 | Early Childhood Education | 22.3% | 6.6% | $45,000 | $52,000 |
| 15 | Miscellaneous Physical Sciences | 22.5% | 2.5% | $60,000 | $81,000 |
Same source and definitions as the table above.
Notice two things. First, education majors rank this well because teaching jobs require the degree, yet their mid-career pay ($55,000 for elementary education) is among the lowest in the data. Low underemployment isn't the same as high pay. Second, computer engineering has the lowest underemployment in tech (15.8%) but the second-highest unemployment of all 73 majors (7.8%), a sign of a tight entry-level tech market in 2024. When those grads get hired, it's into real engineering jobs.
Which of these majors fits your teen?
Take the free adaptive assessment (about 15–25 minutes) to see your top 3 major matches, scored with our own proprietary scoring method. The full Pathfinder report is $29 if you want the deeper plan.
Take the assessment →Is underemployment the same as unemployment?
No, and mixing them up leads families to the wrong conclusions. Unemployment means a grad wants a job and doesn't have one. Underemployment means they have a job, just not one that needs their degree.
The two can point in opposite directions. Agriculture grads have 1.4% unemployment and 57.1% underemployment. Computer engineering grads have 7.8% unemployment and 15.8% underemployment. One major almost guarantees a job of some kind; the other almost guarantees a degree-level job, if you can land one.
For the unemployment side of the story, see our ranking of college majors with the highest and lowest unemployment.
Does underemployment last after the first job?
Often, yes. That's the part that should get a parent's attention. A large study by the Burning Glass Institute and Strada, which drew on the online career histories of tens of millions of graduates, found that 52% of grads were underemployed a year after graduation, and 45% still were a decade later. Worse, 73% of grads who started out underemployed were still underemployed 10 years on. Grads in college-level jobs typically earned 50% more than those who weren't.
There's a calmer side too. The New York Fed's economists looked at what underemployed grads actually do and found the "college grad barista" is more myth than rule (using 2009–2013 data): only about one in five underemployed recent grads, roughly 9% of all recent grads, worked in a low-skilled service job. The biggest group worked in office and administrative support, and many moved up with experience.
So the first job matters a lot. It's not a life sentence, but it is a strong current to swim against.
What majors aren't worth it in 2026?
We get this question a lot, and underemployment alone can't answer it. Political science has underemployment of 48.7%, well above average, yet its mid-career median is $100,000. Elementary education has underemployment of just 16.2% and a mid-career median of $55,000. Which is "worth it" depends on the cost of the degree, the plan after it and what your kid actually wants to do all day.
A better question: does this major have a clear path to a degree-level job, and does my kid have a plan to get on it? If the answer is no, the major isn't doomed. It just needs the plan. Our guides on degrees that rarely pay off and majors with the best return on investment add the cost side.
How can a student in a high-underemployment major beat the odds?
Three moves help. The first has hard numbers behind it; the other two follow from the pattern in the tables above.
- Do an internship. Ideally two. The Burning Glass and Strada study found the odds of underemployment were 48.5% lower for grads who did at least one internship, after controlling for things like gender, race and the type of college.
- Aim at a specific job title by junior year. The low-underemployment majors all point at a job. A communications major who targets "marketing analyst" or "PR coordinator" is borrowing that advantage.
- Add one hard skill. Data analysis, a coding language, a certification, a second language. It's the difference between "well-rounded" and "hireable" on a resume.
Then run the money side before you commit. Every major in the tables links to its own free loan-vs-upside calculator.
Full list: all 73 majors ranked by underemployment
Show all 73 majors (most to least underemployed)
| Rank | Major | Underemployment | Unemployment | Mid-career pay |
|---|---|---|---|---|
| 1 | Criminal Justice | 65.8% | 3.6% | $80,000 |
| 2 | Performing Arts | 63.9% | 7.0% | $75,000 |
| 3 | Fine Arts | 58.9% | 7.7% | $72,000 |
| 4 | Leisure and Hospitality | 58.1% | 2.7% | $75,000 |
| 5 | Agriculture | 57.1% | 1.4% | $80,000 |
| 6 | Anthropology | 55.3% | 7.9% | $65,000 |
| 7 | Liberal Arts | 54.6% | 3.8% | $75,000 |
| 8 | Foreign Language | 54.0% | 1.6% | $77,000 |
| 9 | Animal and Plant Sciences | 53.5% | 2.5% | $79,000 |
| 10 | Communications | 53.0% | 3.9% | $88,000 |
| 11 | Business Management | 52.6% | 3.8% | $82,000 |
| 12 | Mass Media | 52.1% | 5.2% | $80,000 |
| 13 | Sociology | 52.0% | 4.6% | $79,000 |
| 14 | Biology | 51.1% | 4.3% | $83,000 |
| 15 | Environmental Studies | 50.5% | 6.3% | $80,000 |
| 16 | General Business | 50.4% | 4.3% | $90,000 |
| 17 | History | 50.1% | 4.3% | $80,000 |
| 18 | Ethnic Studies | 49.6% | 4.9% | $90,000 |
| 19 | Marketing | 49.3% | 4.4% | $100,000 |
| 20 | Miscellaneous Technologies | 49.0% | 3.6% | $96,000 |
| 21 | Political Science | 48.7% | 4.5% | $100,000 |
| 22 | English Language | 48.5% | 6.1% | $76,000 |
| 23 | Nutrition Sciences | 48.3% | 4.5% | $70,000 |
| 24 | Psychology | 48.3% | 5.0% | $72,000 |
| 25 | Theology and Religion | 47.5% | 3.1% | $66,000 |
| 26 | Philosophy | 47.1% | 5.1% | $80,000 |
| 27 | Medical Technicians | 47.0% | 6.2% | $80,000 |
| 28 | Miscellaneous Biological Science | 46.9% | 4.4% | $80,000 |
| 29 | Family and Consumer Sciences | 45.6% | 4.3% | $65,000 |
| 30 | Public Policy and Law | 45.5% | 2.2% | $80,000 |
| 31 | Art History | 45.3% | 6.7% | $91,000 |
| 32 | Interdisciplinary Studies | 45.2% | 3.9% | $80,000 |
| 33 | International Affairs | 45.2% | 6.1% | $90,000 |
| 34 | Health Services | 45.1% | 3.8% | $67,000 |
| 35 | Engineering Technologies | 44.4% | 1.7% | $104,000 |
| 36 | Journalism | 43.3% | 2.3% | $87,000 |
| 37 | Geography | 43.0% | 1.6% | $88,000 |
| 38 | Chemistry | 42.8% | 4.3% | $86,000 |
| 39 | Biochemistry | 42.0% | 2.7% | $100,000 |
| 40 | Treatment Therapy | 39.1% | 2.6% | $70,000 |
| 41 | Advertising and Public Relations | 38.1% | 5.7% | $92,000 |
| 42 | General Social Sciences | 38.0% | 2.3% | $75,000 |
| 43 | Commercial Art & Graphic Design | 37.1% | 5.7% | $80,000 |
| 44 | Economics | 33.1% | 3.5% | $115,000 |
| 45 | Industrial Engineering | 31.7% | 4.2% | $100,000 |
| 46 | Earth Sciences | 31.4% | 3.8% | $75,000 |
| 47 | General Engineering | 31.1% | 4.5% | $105,000 |
| 48 | Pharmacy | 30.5% | 5.6% | $85,000 |
| 49 | Social Services | 30.1% | 1.9% | $60,000 |
| 50 | Physics | 29.1% | 6.6% | $105,000 |
| 51 | Business Analytics | 28.7% | 5.0% | $109,000 |
| 52 | General Education | 28.1% | 2.6% | $56,000 |
| 53 | Finance | 27.8% | 2.8% | $112,000 |
| 54 | Miscellaneous Engineering | 26.4% | 3.7% | $105,000 |
| 55 | Mathematics | 26.2% | 5.8% | $100,000 |
| 56 | Architecture | 25.7% | 6.8% | $91,000 |
| 57 | Information Systems & Management | 25.6% | 6.0% | $100,000 |
| 58 | Miscellaneous Education | 24.5% | 1.1% | $60,000 |
| 59 | Miscellaneous Physical Sciences | 22.5% | 2.5% | $81,000 |
| 60 | Early Childhood Education | 22.3% | 6.6% | $52,000 |
| 61 | Secondary Education | 21.7% | 2.1% | $62,000 |
| 62 | Accounting | 21.2% | 2.6% | $97,000 |
| 63 | Electrical Engineering | 21.1% | 3.2% | $123,000 |
| 64 | Mechanical Engineering | 20.1% | 4.4% | $120,000 |
| 65 | Computer Science | 19.1% | 7.0% | $120,000 |
| 66 | Construction Services | 17.9% | 2.2% | $120,000 |
| 67 | Chemical Engineering | 17.9% | 4.7% | $135,000 |
| 68 | Elementary Education | 16.2% | 1.2% | $55,000 |
| 69 | Special Education | 16.0% | 0.7% | $56,000 |
| 70 | Computer Engineering | 15.8% | 7.8% | $131,000 |
| 71 | Civil Engineering | 15.6% | 2.3% | $115,000 |
| 72 | Aerospace Engineering | 14.7% | 2.2% | $130,000 |
| 73 | Nursing | 12.8% | 2.1% | $87,000 |
Frequently asked questions
What major has the highest underemployment rate?
Criminal justice. In the New York Fed's February 2026 table, 65.8% of recent criminal justice grads (ages 22 to 27) worked in jobs that typically don't require a degree, followed by performing arts (63.9%) and fine arts (58.9%).
What major has the lowest underemployment?
Nursing, at 12.8%. Aerospace engineering (14.7%), civil engineering (15.6%), computer engineering (15.8%) and special education (16.0%) round out the five lowest.
What percentage of college graduates are underemployed?
About 4 in 10. The New York Fed's by-major table puts it at 39.4% for recent grads across all majors (2024 data), and its quarterly series showed about 42% in the second quarter of 2026.
Is being underemployed after college permanent?
Not always, but it's sticky. The Burning Glass Institute and Strada found 73% of grads who started out underemployed were still underemployed 10 years later. Internships and a targeted first job search are the best-documented ways to avoid that start.
Is underemployment the same as unemployment?
No. Unemployed grads don't have a job. Underemployed grads have one that doesn't need their degree. Agriculture, for example, has 1.4% unemployment but 57.1% underemployment.
Sources
- Federal Reserve Bank of New York, The Labor Market for Recent College Graduates: Outcomes by Major (released Feb. 4, 2026; 2024 American Community Survey data)
- Federal Reserve Bank of New York, The Labor Market for Recent College Graduates: 2026:Q2 update (released Aug. 6, 2026)
- U.S. Census Bureau, American Community Survey (source data behind the New York Fed's by-major table)
- U.S. Department of Labor, O*NET (used by the New York Fed to classify which jobs require a degree)
- Abel & Deitz, Underemployment in the Early Careers of College Graduates Following the Great Recession, NBER Working Paper 22654
- Abel & Deitz, Working as a Barista After College Is Not as Common as You Might Think, Liberty Street Economics, Jan. 11, 2016
- Burning Glass Institute & Strada Institute for the Future of Work, Talent Disrupted: College Graduates, Underemployment, and the Way Forward (Feb. 2024)
- U.S. Bureau of Labor Statistics, Occupational Outlook Handbook: Police and Detectives (How to Become One)