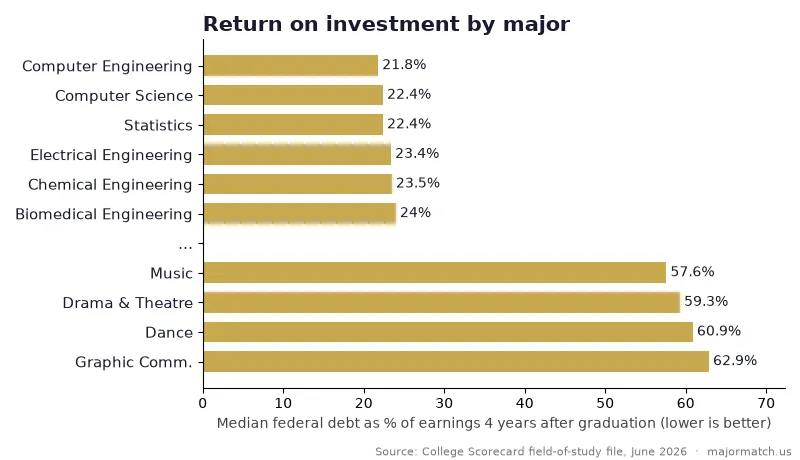
Quick answer: The college majors with the best return on investment are computer engineering, computer science, statistics, electrical engineering and chemical engineering. Graduates in these fields owe a median of roughly $20,000 to $23,000 in federal student loans and earn about $87,000 to $106,000 four years after graduating, so their debt equals only about 22% to 24% of one year's pay. At the other end, arts majors like music, theatre and dance borrow about the same but earn closer to $40,000, so their debt runs near 60% of a year's pay. Source: U.S. Department of Education College Scorecard, 2026 field-of-study file.
Here is a number most families never see before signing the loan papers: how much a typical graduate in a given major owes, compared with what they actually earn a few years out. Not the school's brochure number. The government's.
It turns out the debt side barely moves. Across bachelor's programs in the College Scorecard, median federal loan debt sits between about $19,000 and $27,000 in almost every field, largely because federal loan limits cap what undergraduates can borrow. What moves, dramatically, is the paycheck. That's why return on investment comes down mostly to which major you pick, and much less to how much you borrow for it. (A school's sticker price matters too, and we'll get to that.)
How did we measure return on investment by major?
We downloaded the U.S. Department of Education's College Scorecard field-of-study file (dated June 10, 2026) and kept every bachelor's degree program that reports both median federal loan debt and median earnings four years after graduation. Then, for each field of study (4-digit CIP code), we took the median across programs. We only ranked fields with at least 40 programs reporting both numbers, which left 115 fields.
Our ROI measure is simple: median debt ÷ median earnings four years after graduation. Lower is better. A 22% ratio means a typical grad owes about a quarter of one year's pay. A 60% ratio means they owe more than half.
Know the limits. Scorecard debt counts federal loans only (not private loans or Parent PLUS loans) and earnings cover graduates who received federal aid and were working, not enrolled. It's the best national field-by-field data that exists, but it's not your family's exact number. Use the calculator links in the table to run your own.
Which 15 majors have the best return on investment?
| Rank | Major | Median Federal Debt | Earnings 1 Yr After | Earnings 4 Yrs After | Debt ÷ Yr-4 Pay | Programs |
|---|---|---|---|---|---|---|
| 1 | Computer Engineering | $23,000 | $79,200 | $105,600 | 21.8% | 192 |
| 2 | Computer Science | $22,100 | $70,900 | $98,400 | 22.4% | 358 |
| 3 | Statistics | $19,600 | $60,200 | $87,300 | 22.4% | 50 |
| 4 | Electrical Engineering | $23,100 | $77,600 | $98,600 | 23.4% | 261 |
| 5 | Chemical Engineering | $22,700 | $73,100 | $96,800 | 23.5% | 159 |
| 6 | Biomedical Engineering | $22,600 | $64,900 | $94,100 | 24.0% | 118 |
| 7 | Construction Management | $22,800 | $72,700 | $93,400 | 24.4% | 57 |
| 8 | Aerospace Engineering | $23,700 | $72,400 | $96,500 | 24.6% | 59 |
| 9 | Industrial Engineering | $24,300 | $74,800 | $97,800 | 24.9% | 96 |
| 10 | Mechanical Engineering | $22,900 | $70,700 | $91,100 | 25.1% | 321 |
| 11 | Industrial Production Technologies | $21,200 | $59,800 | $81,400 | 26.1% | 52 |
| 12 | Economics | $20,800 | $51,800 | $79,500 | 26.1% | 370 |
| 13 | Environmental Engineering | $21,500 | $64,600 | $81,700 | 26.3% | 46 |
| 14 | Business/Managerial Economics | $20,800 | $53,300 | $78,900 | 26.4% | 85 |
| 15 | Air Transportation (Aviation) | $22,100 | $43,000 | $83,300 | 26.5% | 54 |
Source: U.S. Department of Education, College Scorecard, Most Recent Cohorts Field of Study file (June 10, 2026). Bachelor's programs only; values are medians across programs reporting both debt and 4-year earnings; dollar figures rounded to the nearest $100. Fields with fewer than 40 reporting programs excluded. Ranking calculation by MajorMatch.
Click any major in the table to open its free loan-vs-upside calculator, or compare debt and lifetime earnings with your own numbers in the degree loan vs. upside calculator. Then take the assessment to see which of these majors actually fit your teen.
What stands out in the ROI ranking?
Ten of the top fifteen are engineering, engineering technology or computing. That's not a surprise. What's more useful are the exceptions.
Computer engineering (#1) and computer science (#2)
Computer engineering grads earn a median of about $105,600 four years out on roughly $23,000 of federal debt. Computer science is right behind at about $98,400. Both start high (about $79,200 and $70,900 one year after graduation) and keep climbing. Recent hiring has been bumpier for new CS grads, and the New York Fed shows computer engineering with 7.8% unemployment for recent grads, so treat the number as a strong average, not a guarantee.
Statistics (#3): the quiet one
Statistics grads borrow the least of any top-15 field (about $19,600) and earn about $87,300 by year four. If your teen likes math but not engineering, this is the most underrated pick on the board.
Construction management (#7): the non-engineering standout
About $93,400 four years out with roughly $22,800 in debt. It's a hands-on, people-and-schedules major that sits right among the engineering degrees in ROI. Our high-paying majors without heavy math list explains why it barely missed that cut.
Economics (#12) and aviation (#15)
Economics is the best ROI major outside STEM and engineering in the data, at about 26% debt-to-earnings. Aviation is interesting: year-one pay is low (about $43,000, when many grads are building flight hours as instructors), then jumps to about $83,300 by year four.
Nursing (#16): just off the list
Registered nursing, with 1,029 programs reporting (the most of any field near the top), lands at #16 with about $86,400 in year-four earnings and a 26.6% ratio. It also has the highest year-one pay outside engineering and computing, about $75,100.
Which majors have the lowest return on investment?
These are the eight fields at the bottom of the 115 we ranked. Debt is about the same as the top of the list. Earnings are about half.
| Rank (of 115) | Major | Median Federal Debt | Earnings 1 Yr After | Earnings 4 Yrs After | Debt ÷ Yr-4 Pay | Programs |
|---|---|---|---|---|---|---|
| 108 | Human Services | $25,800 | $36,600 | $48,800 | 52.9% | 99 |
| 109 | Film, Video & Photography | $23,900 | $25,300 | $44,000 | 54.3% | 162 |
| 110 | Visual & Performing Arts, General | $23,600 | $25,700 | $41,200 | 57.4% | 72 |
| 111 | Fine & Studio Arts | $23,700 | $24,500 | $41,200 | 57.5% | 449 |
| 112 | Music | $25,000 | $26,100 | $43,400 | 57.6% | 275 |
| 113 | Drama & Theatre Arts | $23,700 | $20,700 | $40,100 | 59.3% | 260 |
| 114 | Dance | $24,800 | $21,900 | $40,700 | 60.9% | 60 |
| 115 | Graphic Communications | $26,900 | $25,400 | $42,800 | 62.9% | 66 |
Source: College Scorecard field-of-study file (June 10, 2026); same method as the table above.
None of this means an arts degree is a mistake. It means the money has to come from somewhere else: a scholarship, a cheaper school, a strong portfolio, or a plan to borrow less. A music major who graduates with $8,000 in debt has a very different ROI than one with $40,000. That's the point of running your own numbers.
Which of these majors fits your teen?
Take the free adaptive assessment (about 15–25 minutes) to see your top 3 major matches, scored with our own proprietary scoring method. The full Pathfinder report is $29 if you want the deeper plan.
Take the Free Assessment →Does the school's price change the ROI picture?
Yes, and by more than most families expect. According to NCES, the average total cost of attendance in 2022–23 for a first-time, full-time student living on campus was $27,100 a year at public four-year schools and $58,600 at private nonprofit ones. Over four years, that gap is more than $120,000 before aid.
Scorecard debt numbers look similar across majors because federal loan limits cap what students can borrow, not because every degree costs the same. When a family covers the rest with savings, Parent PLUS loans or private loans, that money doesn't show up in our table. So the real question is: what will your family pay, and what does your teen's major tend to earn? Our degree loan vs. upside calculator does exactly that comparison with your numbers.
Do graduates in high-ROI majors feel it was worth it?
Mostly, yes. In the Federal Reserve's 2023 Survey of Household Economics and Decisionmaking, 73% of adults who studied engineering said the benefits of their education exceeded the costs, the highest of any field. Engineering grads were also the least likely to say they'd pick a different field (27%). We go deeper on that in our college majors ranked by regret post.
ROI isn't the only thing that matters, though. The same engineering majors sit at the top of our hardest majors ranking, and a student who switches out after two years gets the debt without the degree. The best-ROI major for your teen is the one they'll actually finish.
How do you find the best-ROI major for your teen?
Start with fit, then check the money. Our free assessment matches your teen to 100 majors using our own proprietary scoring method, built on strengths, interests and real salary and demand data. Take the top three it suggests, click each one in the table above, and run it through the loan-vs-upside calculator with your actual school costs. That combination, a major that fits and a price that makes sense, is what return on investment looks like in real life.
Frequently asked questions
Is a business management degree worth it in 2026?
It's mid-pack on return on investment: business administration and management ranks #51 of 115 fields, with about $23,500 in median federal debt and about $64,400 in earnings four years out (debt is 36.5% of a year's pay).
Is a marketing degree worth it in 2026?
Marketing ranks #39 of 115 fields on return on investment, with median federal debt of about $22,600 against about $66,500 in earnings four years after graduation (34.0% of a year's pay).
Is a liberal arts degree worth it?
Liberal arts and general studies ranks #83 of 115: about $23,100 in median federal debt against about $52,500 in year-four earnings (44.0%). It can pay off with a clear career plan or a cheap school.
Which college degrees are least worth the cost?
By debt relative to pay, the weakest returns are in graphic communications, dance, drama and theatre, music and fine arts, where median federal debt equals roughly 57% to 63% of year-four earnings.
Which college major has the best return on investment?
Computer engineering, in the 2026 College Scorecard data. Bachelor's grads owe a median of about $23,000 in federal loans and earn about $105,600 four years after graduating, so their debt is about 22% of a year's pay.
Which major has the worst return on investment?
Among the 115 bachelor's fields we ranked, graphic communications, dance, drama/theatre, music and fine arts have the highest debt relative to earnings, with debt equal to about 57% to 63% of year-four pay.
Is nursing a good return on investment?
Yes. Nursing ranks #16 of 115 fields, with about $86,400 in earnings four years out on about $23,000 of federal debt, and the highest year-one pay of any field outside engineering and computing in our top 16.
How is ROI calculated in this ranking?
We divided median federal loan debt by median earnings four years after graduation for each bachelor's field in the College Scorecard, using the median across programs. Lower is better.
Does where you go to college affect ROI?
A lot. NCES puts the average yearly cost of attendance at $27,100 for public four-year schools and $58,600 for private nonprofits (living on campus, 2022–23). Scorecard debt doesn't include family savings, Parent PLUS or private loans, so check your own costs with a calculator.
Sources
- U.S. Department of Education, College Scorecard, Most Recent Cohorts Field of Study data (file dated June 10, 2026)
- NCES Fast Facts: Tuition costs of colleges and universities (2022–23 cost of attendance)
- Federal Reserve Board, Economic Well-Being of U.S. Households in 2023 (SHED), Figure 31, published May 2024
- Federal Reserve Bank of New York, The Labor Market for Recent College Graduates: Outcomes by Major (Feb. 4, 2026 release, 2024 ACS data)